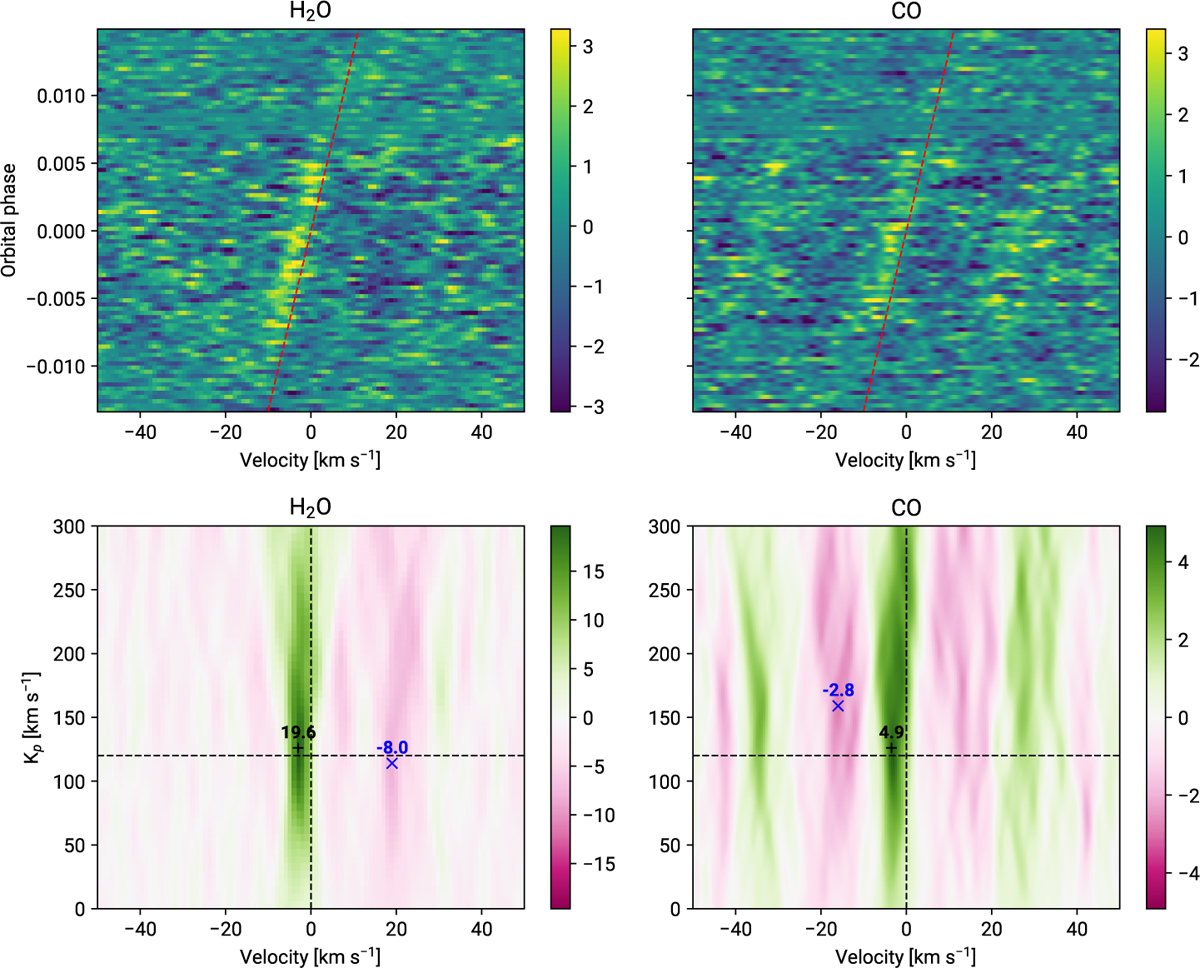
Fig. 3
Download original image
Top panel: phase—vsys maps for the detected species H2O (left) and CO (right) in the stellar reference frame. The red dashed line indicates the predicted velocity trail of the planet. The colour bars are expressed in standard deviations away from both planet and telluric signals (excluding the square in the Kp-Vsys map defined by Kp ∈ [0,300] and Vsys ∈ [−10,30]). Bottom panel: Kp-vsys map for H2O (left) and CO (right), the vertical dashed line indicates the stellar reference frame, the horizontal dashed line indicates Kp = 120 km s−1. The maximum value of the map is indicated by the + symbol in black with the associated value, while the minimum is indicated by the blue cross.
Current usage metrics show cumulative count of Article Views (full-text article views including HTML views, PDF and ePub downloads, according to the available data) and Abstracts Views on Vision4Press platform.
Data correspond to usage on the plateform after 2015. The current usage metrics is available 48-96 hours after online publication and is updated daily on week days.
Initial download of the metrics may take a while.