Fig. 1.
Download original image
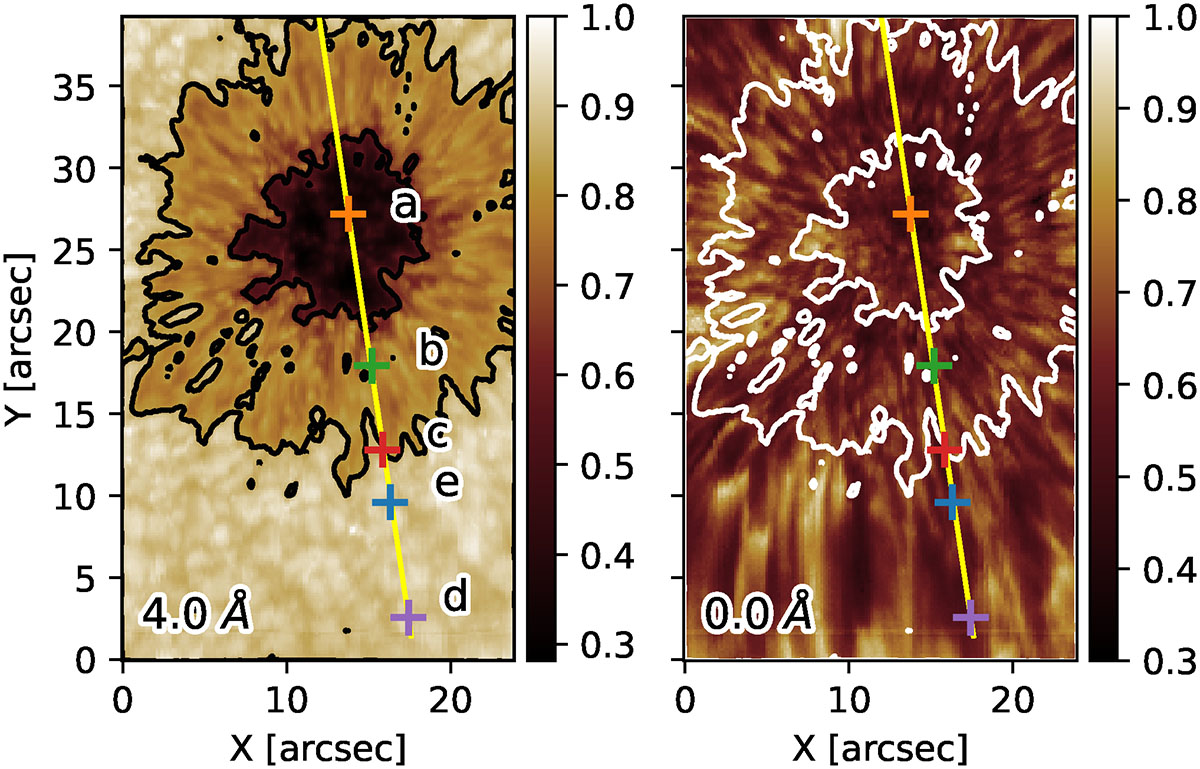
Photospheric and chromospheric raster images of a sunspot, NOAA AR 13798, obtained at Hα + 4 Å and at the Hα line center, respectively, observed on 2024 August 25 at 19:44:57 UT. Black and white contours represent the boundaries of the umbra and penumbra, respectively. The yellow line denotes the slit position used for the time-distance map analysis shown in Fig. 5. Colored “+” symbols mark the five positions used to investigate the temporal variation in the LoS Doppler velocity and their corresponding EMD modes: (a) umbra (orange), (b) penumbra (green), (c) penumbral boundary (red), (d) outer superpenumbra (purple), and (e) inner superpenumbra (blue).
Current usage metrics show cumulative count of Article Views (full-text article views including HTML views, PDF and ePub downloads, according to the available data) and Abstracts Views on Vision4Press platform.
Data correspond to usage on the plateform after 2015. The current usage metrics is available 48-96 hours after online publication and is updated daily on week days.
Initial download of the metrics may take a while.