Open Access
Fig. 4.
Download original image
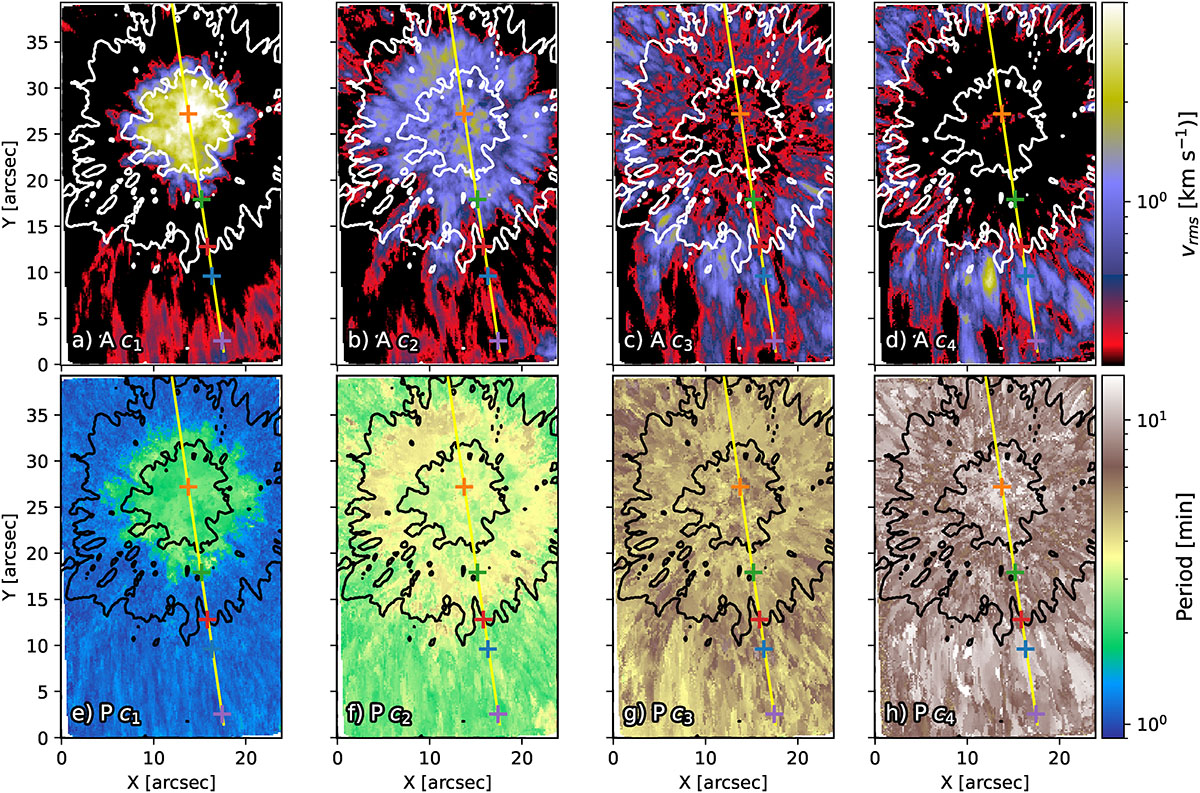
Maps of the velocity amplitude (top) and period (bottom) on a logarithmic scale for each EMD mode. The columns from left to right correspond to an increasing mode number, from c1 to c4. White contours in the top row and black contours in the bottom row denote the boundaries of the umbra and penumbra.
Current usage metrics show cumulative count of Article Views (full-text article views including HTML views, PDF and ePub downloads, according to the available data) and Abstracts Views on Vision4Press platform.
Data correspond to usage on the plateform after 2015. The current usage metrics is available 48-96 hours after online publication and is updated daily on week days.
Initial download of the metrics may take a while.