Fig. 5.
Download original image
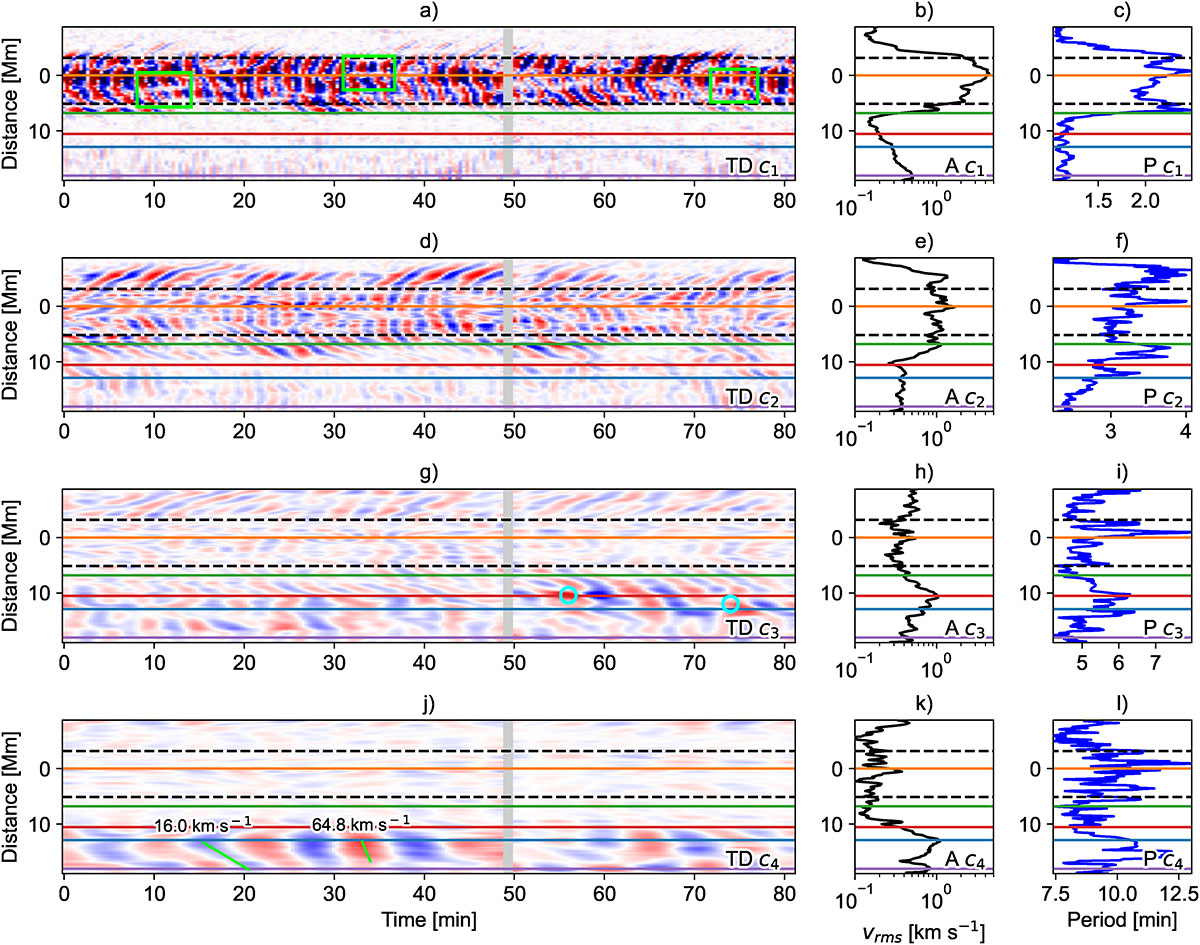
Time-distance maps (left), RMS velocity (middle), and period (right) along the yellow slit marked in Fig. 1, for each EMD mode. The EMD modes are arranged in rows in increasing order from c1 to c4. Dashed black lines indicate the umbral boundaries, and each colored line corresponds to the positions marked with the same colors in Fig. 1. In panel (a), lime boxes mark the region where dislocations occur. Cyan circles in panel (g) represent shock merging regions. Lime-colored slopes and their associated values in panel (j) indicate the apparent propagation speeds derived from the slopes. The color scale for the time-distance maps ranges from –5 to 5 km s−1. As in Fig. 2, the observation start time is set to 0, and the gray areas represent intervals with missing data. Distance 0 corresponds to point “a” in Fig. 1.
Current usage metrics show cumulative count of Article Views (full-text article views including HTML views, PDF and ePub downloads, according to the available data) and Abstracts Views on Vision4Press platform.
Data correspond to usage on the plateform after 2015. The current usage metrics is available 48-96 hours after online publication and is updated daily on week days.
Initial download of the metrics may take a while.