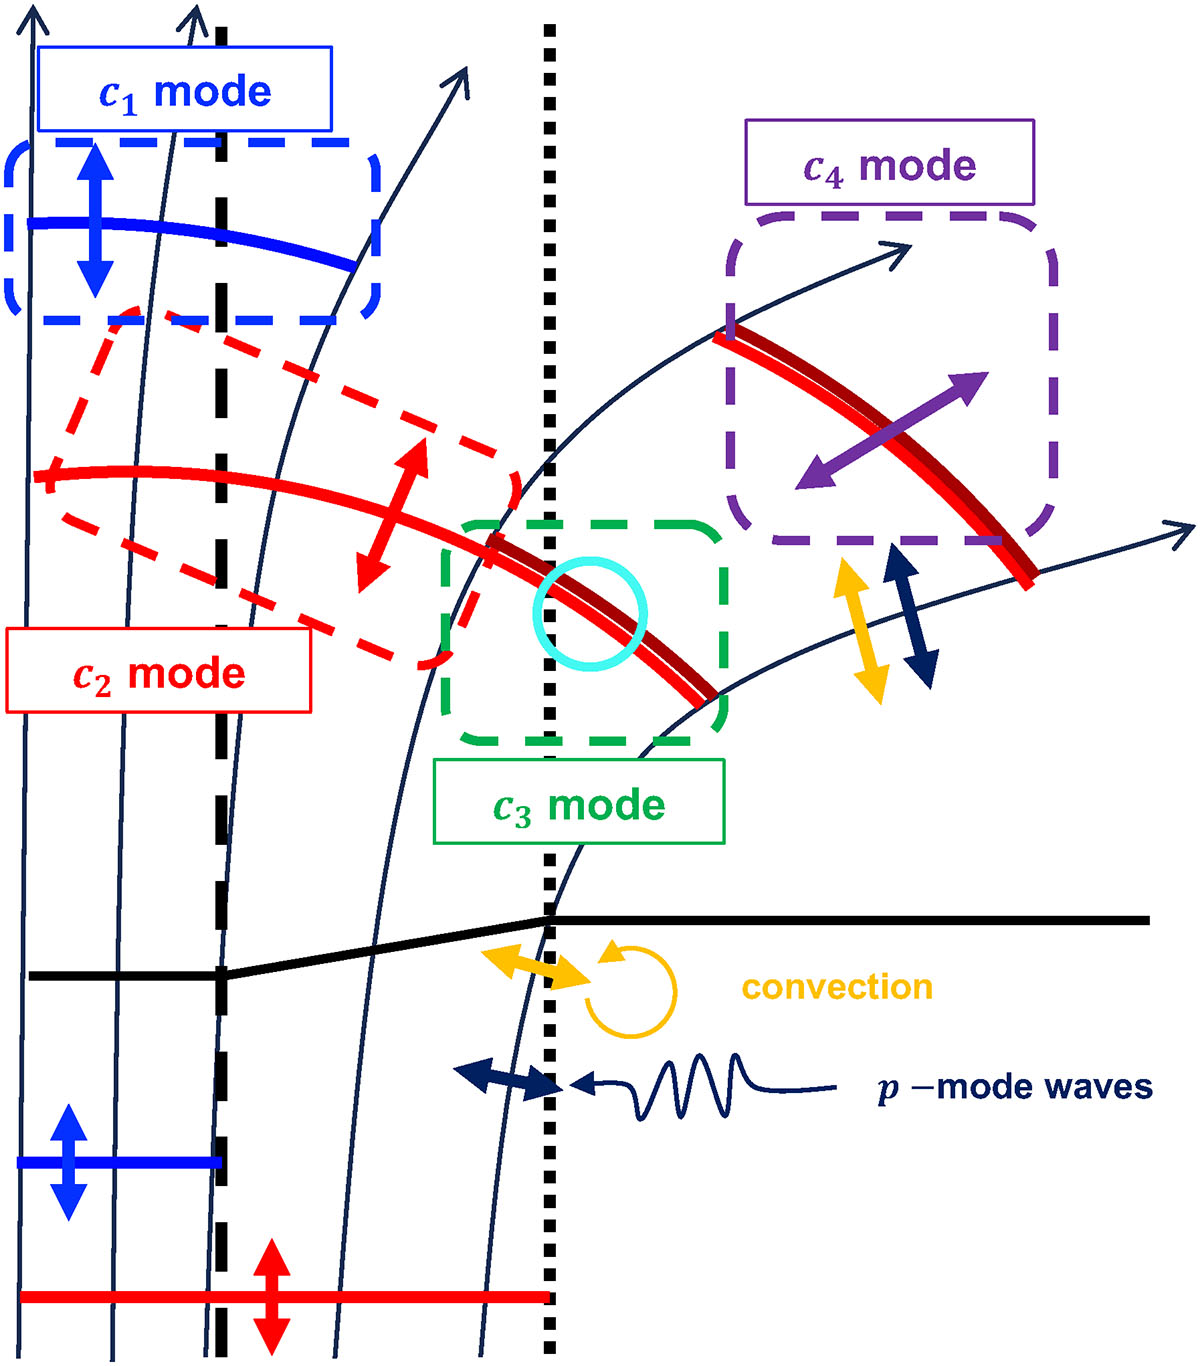
Fig. 7.
Download original image
Schematic illustration of each EMD mode. Thin solid black lines in the background represent the magnetic field configuration, while the thick black line denotes the photospheric surface. Dashed and dotted black lines indicate the umbral and penumbral boundaries, respectively. Blue and red curves represent the wavefronts of the c1 and c2 modes, respectively. The cyan circle highlights the shock merging region. The dark red line near the penumbral boundary illustrates the leading shock front, where the preceding wavefront (red line) merges. Bidirectional arrows indicate the direction of oscillations: blue for c1, red for c2, purple for merged-shock oscillations, yellow for convection-driven kink oscillations, and navy for p-mode-driven kink oscillations.
Current usage metrics show cumulative count of Article Views (full-text article views including HTML views, PDF and ePub downloads, according to the available data) and Abstracts Views on Vision4Press platform.
Data correspond to usage on the plateform after 2015. The current usage metrics is available 48-96 hours after online publication and is updated daily on week days.
Initial download of the metrics may take a while.