Open Access
Fig. 3
Download original image
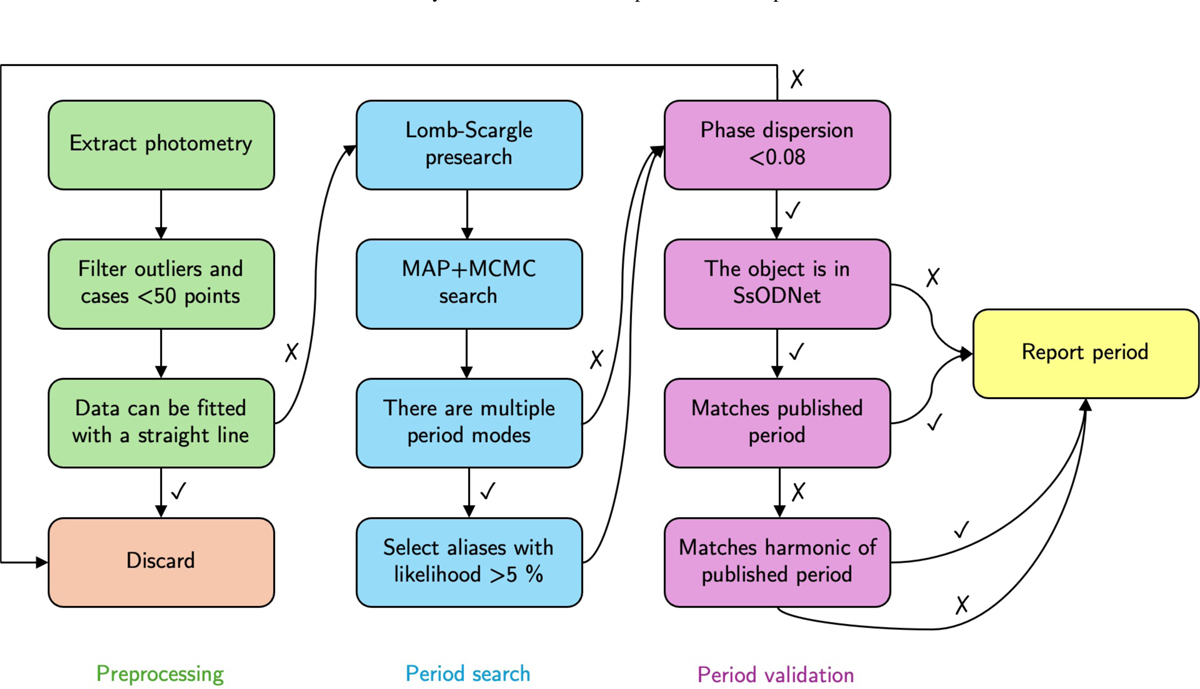
Diagram summarising the general workflow of our pipeline. We first build our light curves, excluding the outliers and cases with insufficient signal. Then, we search the period using multiple algorithms and, after filtering, compare our results with those published in the catalogue.
Current usage metrics show cumulative count of Article Views (full-text article views including HTML views, PDF and ePub downloads, according to the available data) and Abstracts Views on Vision4Press platform.
Data correspond to usage on the plateform after 2015. The current usage metrics is available 48-96 hours after online publication and is updated daily on week days.
Initial download of the metrics may take a while.