Fig. 1
Download original image
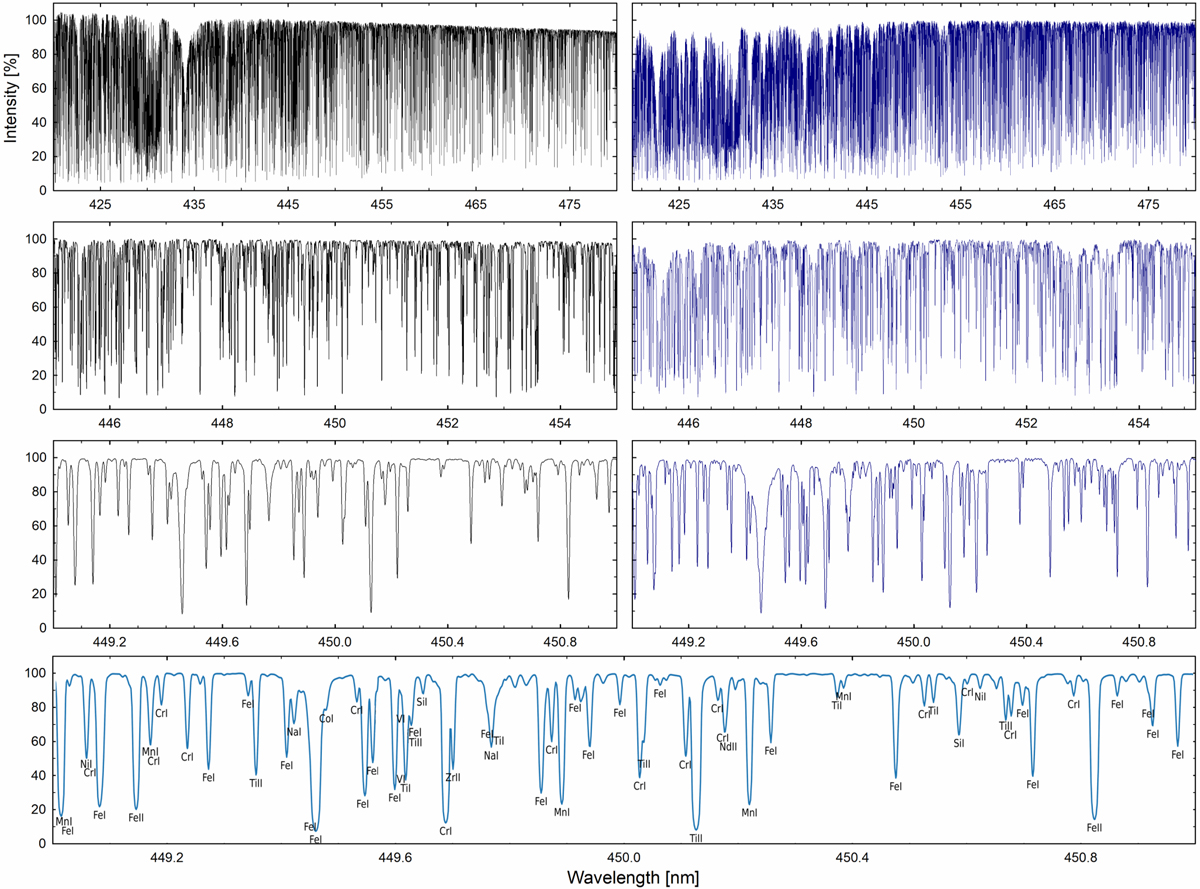
Examples of synthetic spectra at the solar disk center, μ = 1, for the nonmagnetic (left) and the magnetic 240 mT (2400 G) simulation, expanded in wavelength from top down. Each section is normalized locally while the lower frame shows line identifications. From that region, the lines of Fe II 449.1405 and Fe II 450.8288 nm were selected for detailed study (Fig. 4 below). The wavelength scale denotes values in air.
Current usage metrics show cumulative count of Article Views (full-text article views including HTML views, PDF and ePub downloads, according to the available data) and Abstracts Views on Vision4Press platform.
Data correspond to usage on the plateform after 2015. The current usage metrics is available 48-96 hours after online publication and is updated daily on week days.
Initial download of the metrics may take a while.