Fig. 3
Download original image
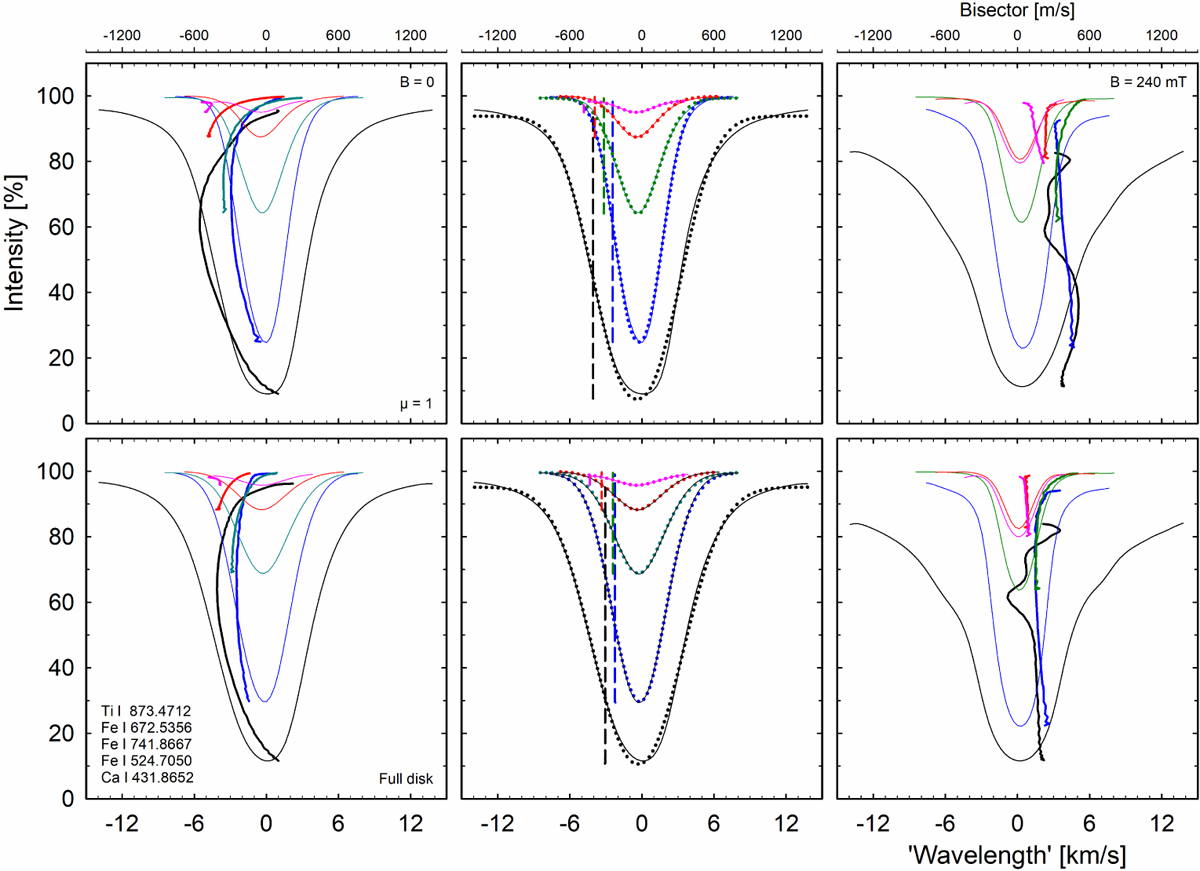
Modeled and fitted line profiles. Left: profiles and bisectors for differently deep absorption lines, as obtained from time-averaged 3D simulations of nonmagnetic granulation. Wavelengths are in velocity units relative to each line’s laboratory wavelength. At the top, the bisector scale is expanded tenfold. The central column shows the same profiles from these simulations (dotted), now together with their fitted profiles (solid) using a five-parameter Gaussiantype function. Since the fitted profiles are symmetric, their dashed bisectors are vertical limes, defining each line’s average radial velocity. The right column shows the same lines in the 240 mT (2400 G) magnetic simulation. The upper row gives data for solar disk center, μ = 1; the lower row is for integrated sunlight. The lines are listed at the bottom left, in order of increasing line depth. Bisector wiggles for the strongest magnetic line are caused by blends in its broad wings. The effects of solar rotation and gravitational redshift are not included.
Current usage metrics show cumulative count of Article Views (full-text article views including HTML views, PDF and ePub downloads, according to the available data) and Abstracts Views on Vision4Press platform.
Data correspond to usage on the plateform after 2015. The current usage metrics is available 48-96 hours after online publication and is updated daily on week days.
Initial download of the metrics may take a while.