Fig. 4
Download original image
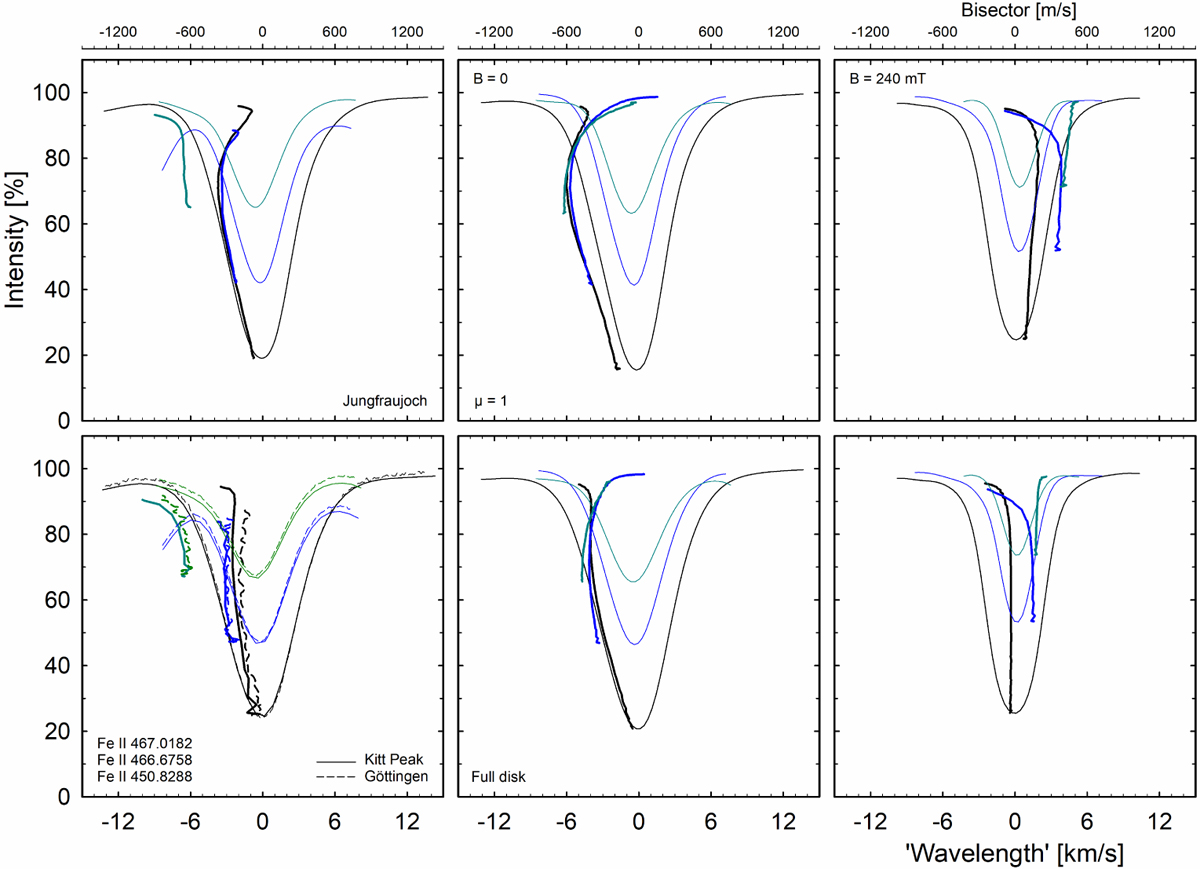
Line profiles and bisectors for differently strong Fe II lines. The leftmost column shows observed data from the Jungfraujoch solar disk-center atlas (top) and the integrated solar flux atlases of Kitt Peak and Göttingen (bottom). Profiles from the nonmagnetic (center) and magnetic 240 mT = 2400 G simulations (right) are shown for disk center μ = 1 (upper row) and for integrated sunlight of a nonrotating Sun (lower row). The wavelength scales are relative to the laboratory values used as input to the simulations, while the observational atlases are affected by solar gravitational redshift of 635 m s−1 and likely errors in laboratory wavelengths.
Current usage metrics show cumulative count of Article Views (full-text article views including HTML views, PDF and ePub downloads, according to the available data) and Abstracts Views on Vision4Press platform.
Data correspond to usage on the plateform after 2015. The current usage metrics is available 48-96 hours after online publication and is updated daily on week days.
Initial download of the metrics may take a while.