Fig. 6
Download original image
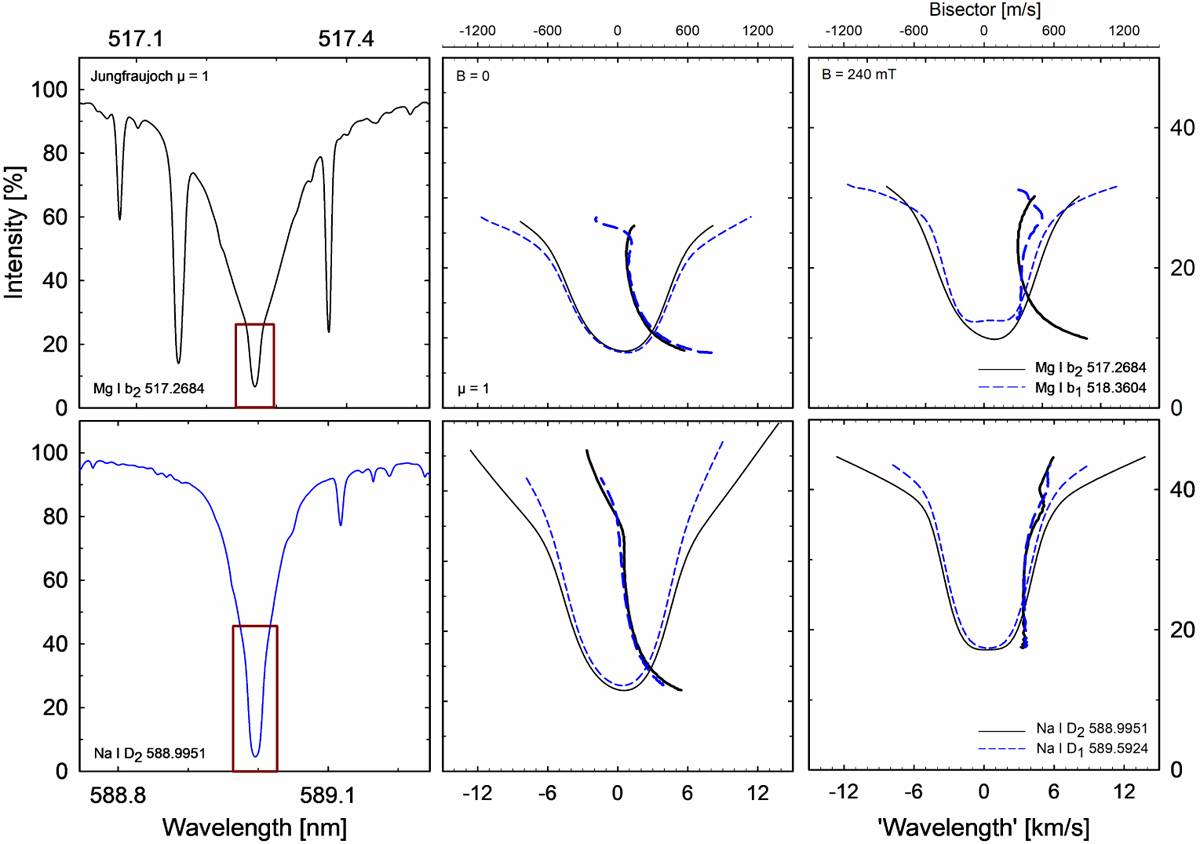
Very strong lines at solar disk center. Left: Mg I b2 and Na I D2 lines in the Jungfraujoch atlas. Center: synthetic profiles and bisectors for their line cores (corresponding to the boxes at left), and also the related Mg I b1 and Na I D1 lines for the nonmagnetic simulation. Right: 240 mT = 2400 G magnetic case. The effects of solar rotation and gravitational redshift are not included.
Current usage metrics show cumulative count of Article Views (full-text article views including HTML views, PDF and ePub downloads, according to the available data) and Abstracts Views on Vision4Press platform.
Data correspond to usage on the plateform after 2015. The current usage metrics is available 48-96 hours after online publication and is updated daily on week days.
Initial download of the metrics may take a while.