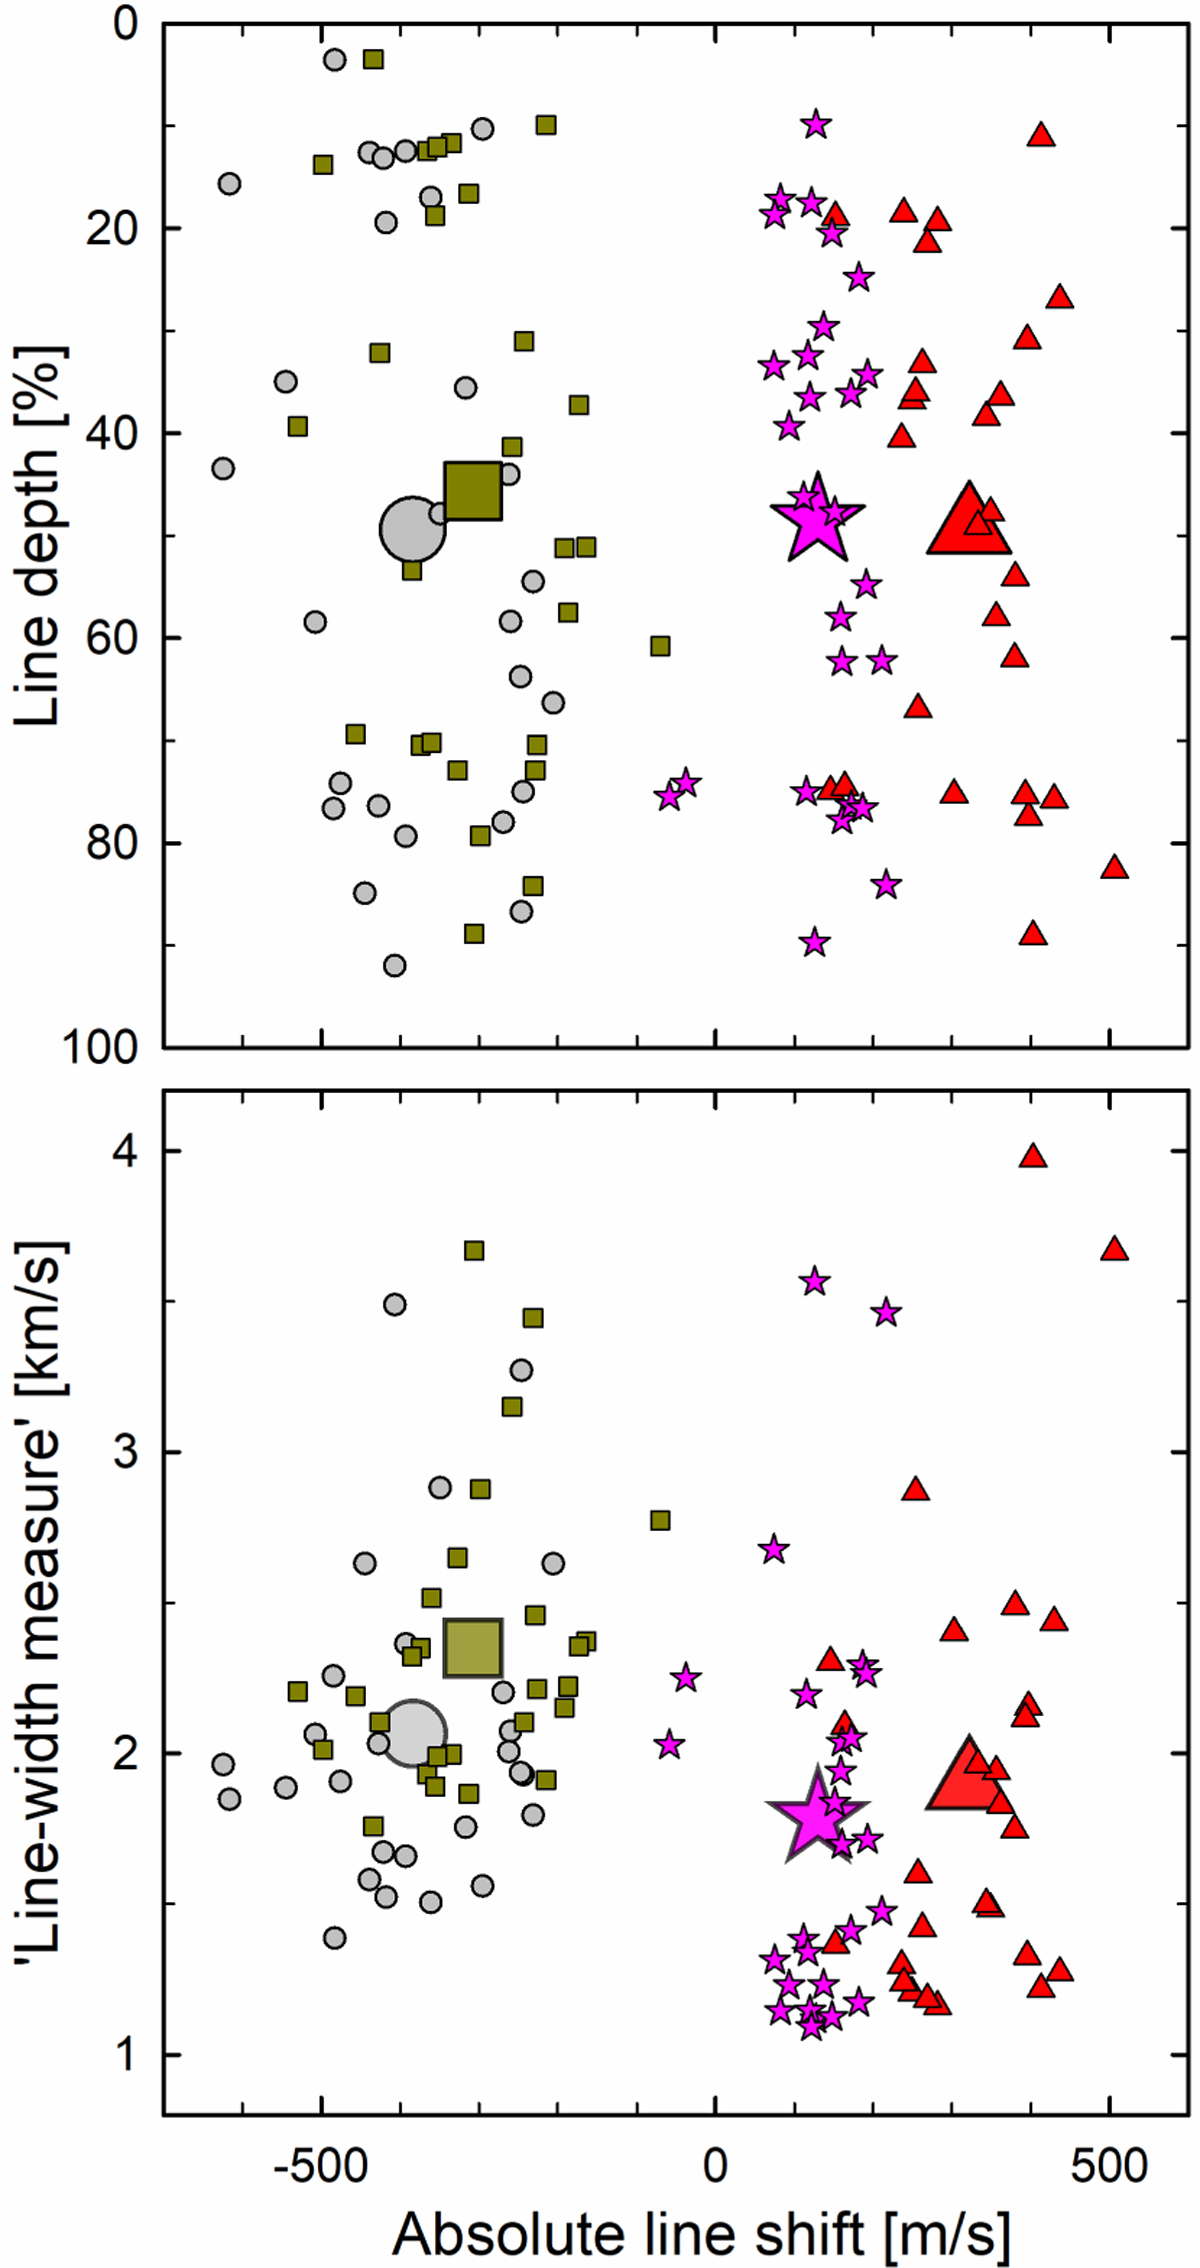
Fig. 8
Download original image
Radial-velocity shifts for ordinary lines (Table A.1). The gray circles are lines from the nonmagnetic simulation at solar disk center; the dark squares are for the full solar disk. The red triangles are from the magnetic model at disk center; the purple stars are magnetic full disk. Small symbols denote specific spectral lines, large symbols their total average. Line depth denotes absorption in units of the local continuum; weak lines thus carry small numbers. Each line’s average wavelength and line width measure is obtained from fitting the synthetic profiles to a symmetric five-parameter Gaussian-type function. The modeled lines are not affected by either solar rotation or gravitational redshift.
Current usage metrics show cumulative count of Article Views (full-text article views including HTML views, PDF and ePub downloads, according to the available data) and Abstracts Views on Vision4Press platform.
Data correspond to usage on the plateform after 2015. The current usage metrics is available 48-96 hours after online publication and is updated daily on week days.
Initial download of the metrics may take a while.