Fig. 9
Download original image
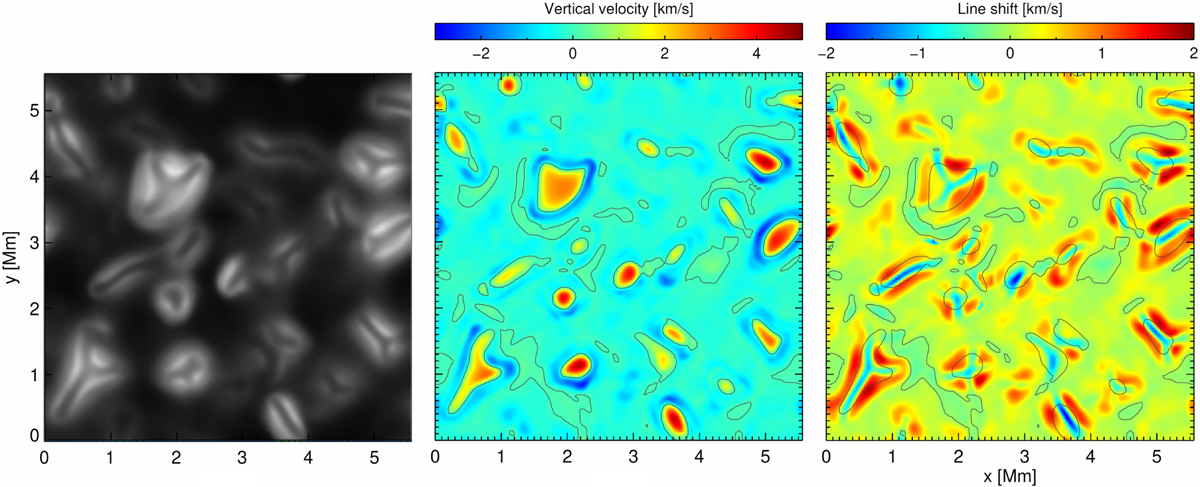
Brightness, gas velocities, and radial velocities in one temporal snapshot of the magnetic 3D simulation for 240 mT = 2400 G. Left: continuum intensity at solar disk center (μ = 1) near Fe I 683.7 nm. Center: vertical gas velocity (measured positive rising upward in the atmosphere) over a horizontal plane near Rosseland optical depth unity. The thin black lines depict the vz = 0 contour separating the up- and downflows. Right: spectroscopic lineshifts for Fe I 683.7 nm (measured positive redshifted if receding downward into the atmosphere, thus inverting the color scale).
Current usage metrics show cumulative count of Article Views (full-text article views including HTML views, PDF and ePub downloads, according to the available data) and Abstracts Views on Vision4Press platform.
Data correspond to usage on the plateform after 2015. The current usage metrics is available 48-96 hours after online publication and is updated daily on week days.
Initial download of the metrics may take a while.