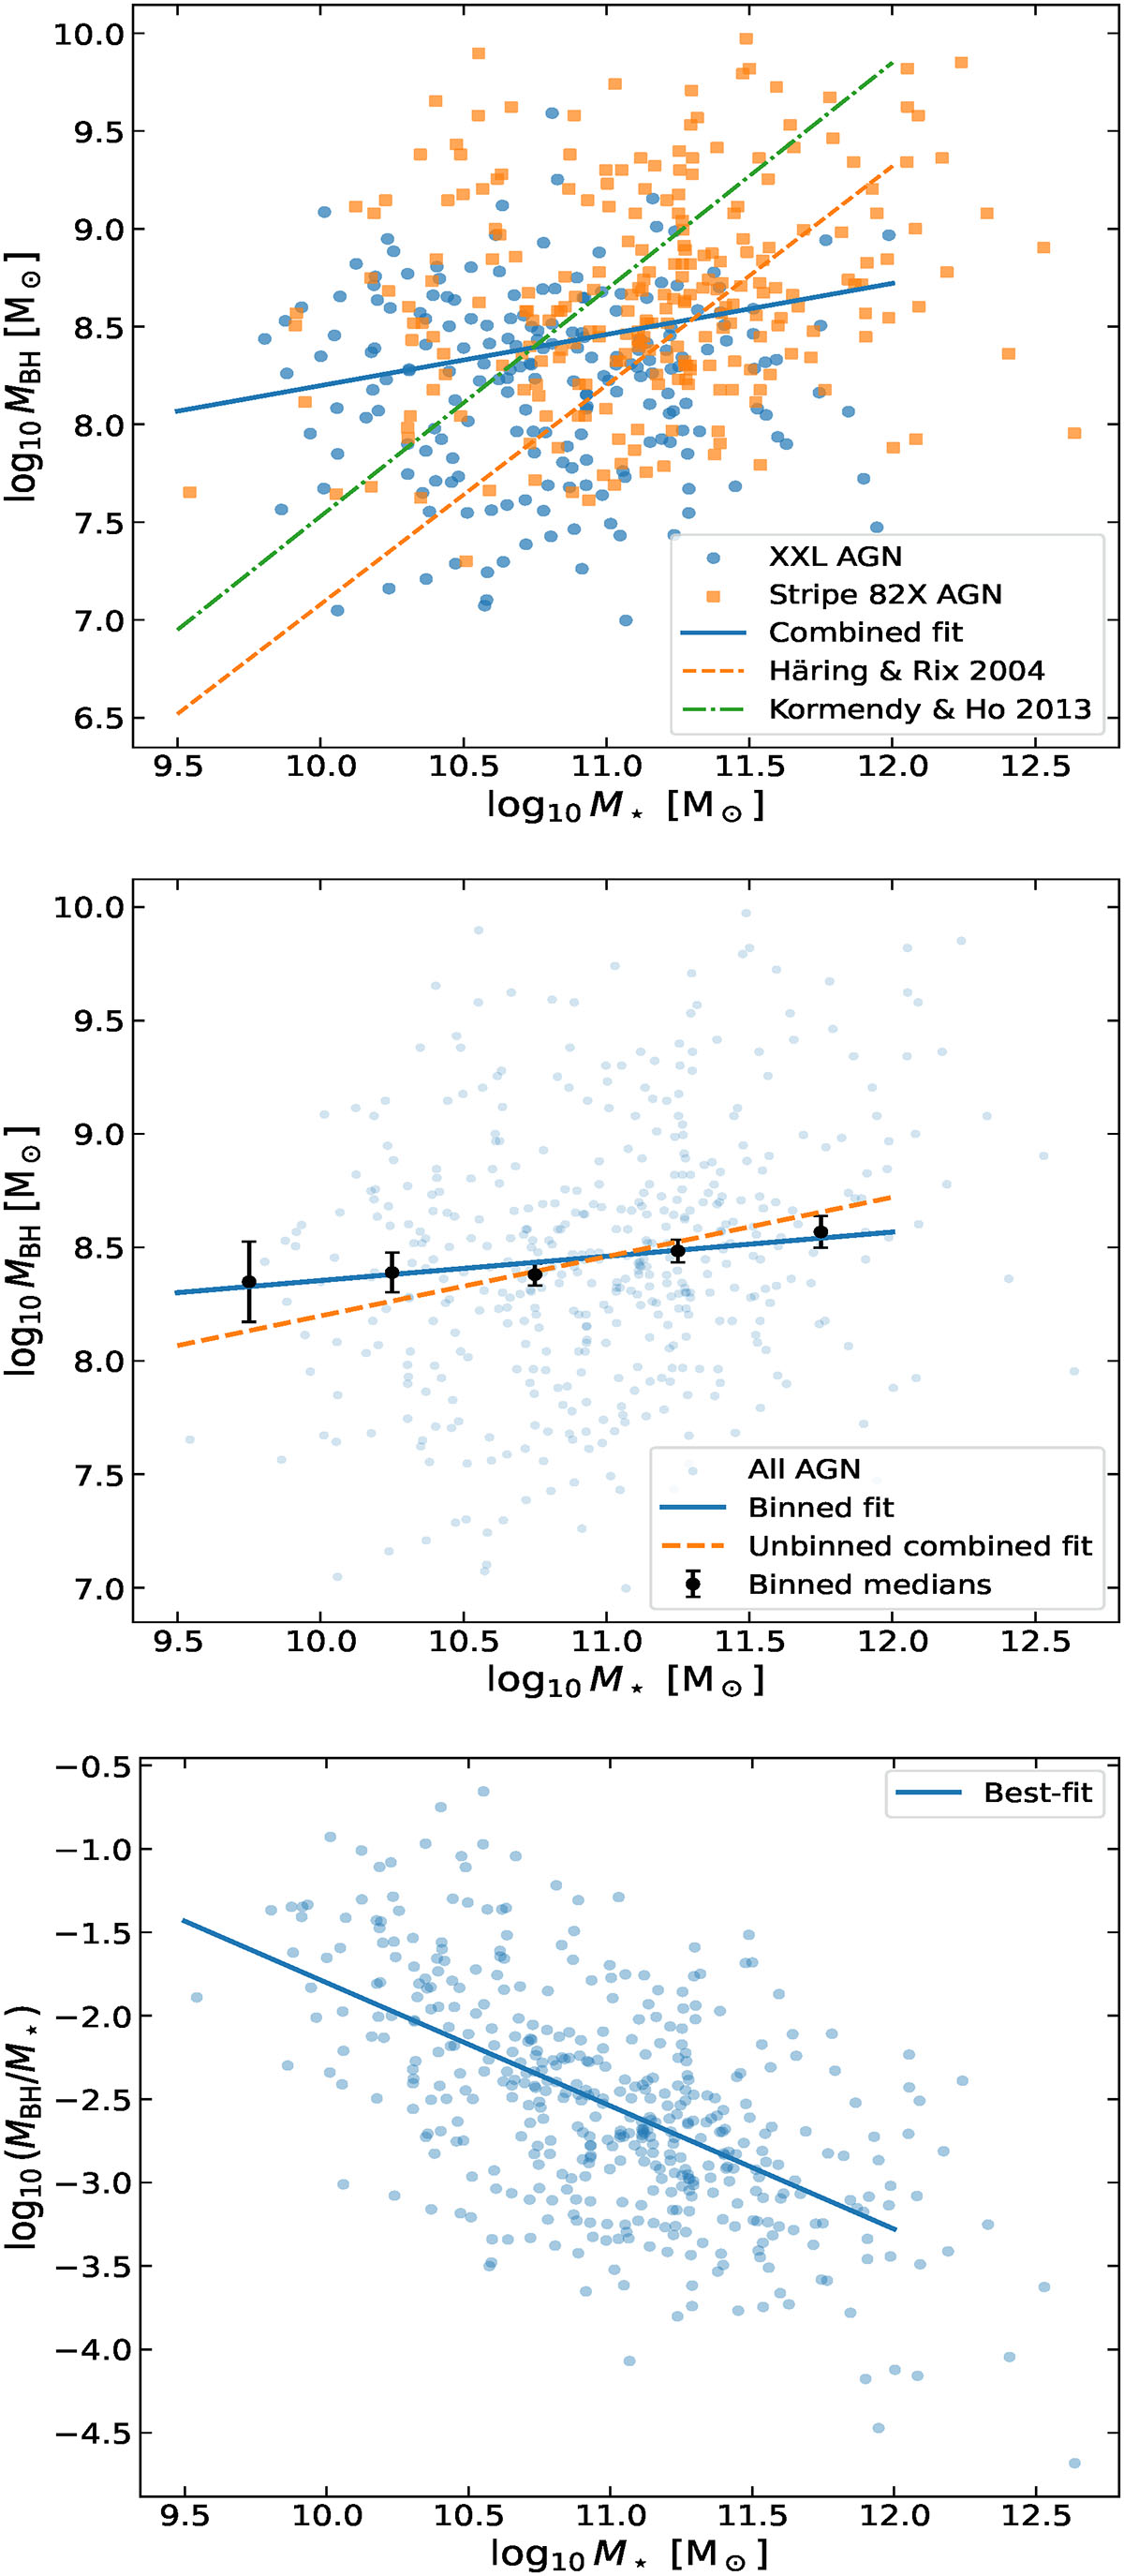
Fig. 1.
Download original image
Relation between MBH and M★. Top: log MBH − log M★ relation for the XXL and Stripe 82X AGN samples, together with the best-fitting linear trend for the combined dataset and the reference relations of Häring & Rix (2004) and Kormendy & Ho (2013). Middle: Median log MBH − log M★ values in M★ bins (black points with bootstrap uncertainties), together with the corresponding binned fit and, for comparison, the unbinned combined fit from the top panel; the full AGN sample is shown in the background. Bottom: log(MBH/M★) as a function of M★ for the combined AGN sample, with the best-fitting linear relation overplotted.
Current usage metrics show cumulative count of Article Views (full-text article views including HTML views, PDF and ePub downloads, according to the available data) and Abstracts Views on Vision4Press platform.
Data correspond to usage on the plateform after 2015. The current usage metrics is available 48-96 hours after online publication and is updated daily on week days.
Initial download of the metrics may take a while.