| Issue |
A&A
Volume 710, June 2026
|
|
|---|---|---|
| Article Number | A55 | |
| Number of page(s) | 10 | |
| Section | Extragalactic astronomy | |
| DOI | https://doi.org/10.1051/0004-6361/202659565 | |
| Published online | 28 May 2026 | |
Black hole mass, host galaxy mass, and dark matter halos: Testing the environmental connection
1
Instituto de Fisica de Cantabria (CSIC-Universidad de Cantabria), Avenida de los Castros, 39005, Santander, Spain
2
Department of Physics and Astronomy, University of Southampton, Highfield, Southampton, SO17 1BJ, UK
3
Institute for Astronomy & Astrophysics, National Observatory of Athens, V. Paulou & I. Metaxa, 11532, Athens, Greece
★ Corresponding author: This email address is being protected from spambots. You need JavaScript enabled to view it.
Received:
23
February
2026
Accepted:
22
April
2026
Abstract
We investigate the relation between supermassive black holes (SMBHs), their host galaxies, and large-scale dark-matter halos by combining broad-line X-ray active galactic nuclei (AGNs) from the XMM–XXL and Stripe 82X surveys with galaxies from VIPERS and SDSS/Stripe 82. Building on the homogeneous host-galaxy catalogue developed in Paper I, we test whether AGNs with a given black-hole mass, MBH, occupy the same or different large-scale environments as non-AGN galaxies with statistically indistinguishable host properties. We characterised the empirical MBH − M★ distribution of the AGN sample. A shallow scaling between MBH and stellar mass, M★, is present, but with a large intrinsic scatter influenced by flux-limited selection and virial-mass uncertainties. The ratio MBH/M★ declines with increasing M★ over the sampled range. Overmassive and undermassive AGN subsets, defined relative to this empirical trend, exhibit distinct median host properties consistent with partially non-synchronous SMBH and M★ growth. We then selected AGNs in two MBH intervals, 8.0 ≤ log(MBH/M⊙) < 8.5 and 8.5 ≤ log(MBH/M⊙) < 9.0, and constructed galaxy control samples matched in M★, SFR, and sSFR (SFR/M★) using a multivariate nearest-neighbour procedure. Using AGN–galaxy cross-correlation functions, we inferred characteristic halo masses for AGNs and matched galaxies in each bin. The AGNs with 8.0 ≤ log(MBH/M⊙) < 8.5 occupy halos statistically indistinguishable from those of their controls, indicating no detectable environmental dependence at these masses once host properties are controlled. In the higher-mass bin, 8.5 ≤ log(MBH/M⊙) < 9.0, we find a mild indication that AGNs may reside in more massive halos than the matched non-AGN galaxies. The inferred difference is ∼0.4 dex but remains formally consistent within the uncertainties. If confirmed with larger samples, this may indicate that halo-scale processes become increasingly relevant only at the highest MBH, while at lower masses AGN environments remain indistinguishable from those of inactive galaxies with similar host properties.
Key words: galaxies: active / galaxies: evolution / galaxies: halos / cosmology: observations / large-scale structure of Universe
© The Authors 2026
 Open Access article, published by EDP Sciences, under the terms of the Creative Commons Attribution License (https://creativecommons.org/licenses/by/4.0), which permits unrestricted use, distribution, and reproduction in any medium, provided the original work is properly cited.
This article is published in open access under the Subscribe to Open model. This email address is being protected from spambots. You need JavaScript enabled to view it. to support open access publication.
1. Introduction
Supermassive black holes (SMBHs) reside at the centres of most galaxies and their growth is intimately linked to the assembly of stellar mass, M★, and the evolution of their hosts. This connection is supported by a set of tight empirical relations between black hole mass, MBH, and bulge properties such as M★ or velocity dispersion (e.g. Magorrian et al. 1998; Marconi & Hunt 2003; Häring & Rix 2004; Kormendy & Ho 2013). Understanding when, where, and under what conditions SMBHs grow therefore requires not only characterising their internal properties, but also the large-scale environments in which they reside. Clustering analyses offer a powerful diagnostic of this connection because they provide direct estimates of the typical dark matter halos (DMHs) hosting active galactic nuclei (AGNs), thereby linking SMBH growth to cosmic structure formation.
Over the past two decades, extensive work has examined AGN environments across a range of redshifts and luminosities. X-ray AGNs have played a central role in this effort owing to their relatively unbiased view of accretion and well-understood selection functions. Large-area surveys such as ROSAT, XMM–Newton, Chandra, and more recently eROSITA have enabled the measurement of AGN clustering over cosmologically representative volumes (e.g. Gilli et al. 2005; Coil et al. 2009; Krumpe et al. 2010; Koutoulidis et al. 2013; Georgakakis et al. 2014; Mendez et al. 2016; Aird et al. 2019; Comparat et al. 2023). A consistent picture has emerged in which moderate-luminosity X-ray AGNs inhabit halos of an approximately constant mass, log(Mhalo/M⊙)∼12.5 − 13, with surprisingly little evolution out to z ∼ 3 if not even higher (Allevato et al. 2011, 2016). At the same time, several studies have reported a dependence of clustering amplitude on X-ray luminosity (LX, e.g. Koutoulidis et al. 2013; Krumpe et al. 2012; Powell et al. 2020), suggesting that the most powerful AGNs may reside in more massive, group-sized halos. These trends raise a fundamental question, of whether AGN Eddington-ratio (λEdd) distributions are largely independent of their environments, implying a relatively simple connection between accretion rate and halo mass, or whether MBH, accretion state, and host-galaxy properties introduce additional layers of environmental dependence.
Efforts to link SMBH mass to AGN clustering have so far yielded mixed results. Optical studies have sometimes reported a weak dependence of quasar clustering on MBH (e.g. Shen et al. 2009), whereas X-ray-selected AGNs generally show little or no such trend (e.g. Krumpe et al. 2015, 2023). In Mountrichas et al. (2026) (hereafter Paper I), we used the combined XMM–XXL and Stripe 82X samples to explore the dependence of clustering on several SMBH properties, including MBH, λEdd, and LX, and found no significant variation in large-scale clustering (i.e. bias) with MBH over the range of 7.5 ≲ log(MBH/M⊙)≲10 probed by those data. This absence of a clear trend is consistent with theoretical and empirical work suggesting that any apparent connection between MBH and halo mass is largely mediated by their mutual dependence on host-galaxy properties, particularly M★. A controlled comparison between AGN and non-AGN galaxies matched in host properties therefore provides a more direct way to test whether active SMBHs of a given mass trace environments that differ from those of inactive galaxies.
The observed correlation between MBH and M★, despite its substantial intrinsic scatter and systematic uncertainties (e.g. Shankar et al. 2016), provides a practical framework for addressing this issue. If AGNs of different MBH truly trace different stages of co-evolution with their hosts, then their environments may differ when compared with galaxies whose M★ correspond to the MBH inferred from the scaling relation. Such comparisons have rarely been carried out, as they require: (i) homogeneous MBH estimates for large numbers of AGNs, with well-understood statistical and systematic uncertainties; (ii) matched galaxy samples spanning the same redshift and M★ ranges; and (iii) a clustering methodology that isolates host-driven differences from those induced by AGN selection.
In this work we bring together the XMM–XXL and Stripe 82X AGN samples from Paper I with high-quality host-galaxy measurements to construct a unified MBH − M★ relation, characterise its scatter, and examine the properties of AGNs lying on, above, and below this relation. Using this relation as an empirical reference, we organise AGNs within two black-hole mass intervals, 8.0 − 8.5 and 8.5 − 9.0, and construct control samples of non-AGN galaxies matched in redshift, M★, star-formation rate (SFR), and specific SFR (sSFR = SFR/M★).
Because M★ is tightly correlated with halo mass, matching in M★ and star-formation properties effectively controls for the primary dependence of galaxy clustering on host properties. This allows us to address a more specific question: whether AGN represent a random subset of galaxies at fixed host-galaxy parameters, or whether the presence of an accreting black hole of a given mass is associated with a systematic difference in the large-scale environment.
This approach provides a complementary perspective to the MBH-based binning explored in Paper I. Rather than comparing AGNs of different MBH to one another, we compare AGNs to inactive galaxies with statistically indistinguishable host properties. Our aim is therefore not to measure a residual dependence of halo mass on MBH at fixed M★, but to test whether the presence of active accretion itself is associated with a different halo environment once host-galaxy properties are controlled. Any difference in clustering would indicate that nuclear activity, at fixed M★ and SFR, is linked to halo-scale processes beyond those encoded in the global stellar-to-halo mass relation. Conversely, the absence of a difference would imply that AGNs are environmentally indistinguishable from inactive galaxies once host properties are controlled.
The paper is organised as follows. Section 2 describes the AGN and galaxy datasets and outlines the clustering methodology. In Section 3 we present the MBH − M★ relation for our AGN samples, while Section 4 focuses on the clustering measurements and derived halo masses. A summary of our main findings and conclusions is provided in Section 5. Throughout this paper, we adopt a flat Λ cold dark matter cosmology with ΩM = 0.315, ΩΛ = 0.685, h = 0.674 (i.e. H0 = 67.4 km s−1 Mpc−1) and σ8 = 0.811, consistent with the Planck Collaboration VI (2020) cosmological parameters.
2. Data
This work uses broad-line X-ray AGNs from the XMM–XXL North and Stripe 82X surveys, together with galaxy samples from VIPERS and SDSS/Stripe 82. A companion analysis (Paper I) investigates AGN clustering as a function of MBH, λEdd, and LX using the same datasets. Here we provide only a concise description of the properties relevant to the MBH − M★ analysis and refer the reader to Paper I for full technical details, including survey characteristics, photometric coverage, and spectral energy distribution (SED)-fitting configuration.
2.1. X-ray AGN
The XMM–XXL North field (Pierre et al. 2016) covers ∼25 deg2 and contains ∼2500 X-ray sources with reliable spectroscopic redshifts (Menzel et al. 2016; Liu et al. 2016). MBH for 1786 BLAGN1 were obtained via single-epoch virial estimators using Hβ, Mg II, or C IV, following the calibrations of Shen et al. (2011).
The Stripe 82X survey (LaMassa et al. 2013a,b, 2015, 2024) spans 31 deg2 and incorporates both Chandra and XMM-Newton observations. In this work we use the DR3 catalogue, which includes black hole mass measurements for 1297 Type 1 AGNs derived from SDSS spectroscopy. For both fields we adopted the rest-frame 2 − 10 keV LX provided in the corresponding catalogues, which were not corrected for intrinsic absorption and were derived assuming a standard spectral model, as appropriate for broad-line AGNs.
2.2. Host-galaxy properties
Host-galaxy M★ and SFR were derived through SED fitting using the same CIGALE-based methodology (Boquien et al. 2019; Yang et al. 2020, 2022) employed in Paper I (see also e.g. Mountrichas et al. 2021b, 2022c; Mountrichas & Shankar 2023; Mountrichas et al. 2023, 2024a; Mountrichas & Georgantopoulos 2024). We required: detections in the optical, near-infrared (NIR), and mid-infrared (MIR) bands (e.g. Mountrichas et al. 2022b, 2024c,b); reduced χr2 ≤ 5 (e.g. Masoura et al. 2018, 2021; Buat et al. 2021); and consistency between best-fit and Bayesian estimates of M★ and SFR (e.g. Mountrichas et al. 2021a, 2022a; Pouliasis et al. 2022; Koutoulidis et al. 2022). After applying these quality filters, 584 AGNs in XXL and 550 AGNs in Stripe 82X remain with reliable host-galaxy parameters.
2.3. Non-AGN galaxy samples
For the XMM–XXL field, we used galaxies from the VIPERS PDR-2 release (Garilli et al. 2014; Scodeggio et al. 2018), which provides ∼45 000 reliable redshifts at 0.5 < z < 1.2. After SED-quality cuts and the removal of systems with a significant AGN contribution (fracAGN > 0.2), the remaining VIPERS sample contains ∼10 000 galaxies (Mountrichas & Buat 2023).
For Stripe 82, we used SDSS galaxies located within the X-ray footprint of the Stripe 82X survey. Applying the same SED-fitting and AGN-removal criteria yields ∼180 000 galaxies with reliable host-galaxy parameters (Mountrichas et al. 2025).
For clustering, we restricted both galaxy samples to the sky regions overlapping the AGN footprint and to the redshift interval 0.5 ≤ z ≤ 1.2. This results in 2428 galaxies (XXL) and 19 141 galaxies (Stripe 82) contributing to the cross-correlation measurements. These samples served as the tracer population for the AGN–galaxy cross-correlation analysis and as the parent pool from which the matched non-AGN control samples were constructed.
2.4. Final AGN and galaxy samples
After enforcing both SED and spatial-overlap requirements, the final clustering samples contain 203 AGNs and 2428 galaxies in the XMM–XXL field, and 245 AGNs and 19 141 galaxies in Stripe 82X (Table 1). These subsets form the basis for the MBH − M★ relation, the classification of overmassive and undermassive AGN, and the environmental measurements presented in this paper.
Final number of AGN and galaxies used in the clustering analysis after all photometric, quality, and redshift cuts, restricted to the overlapping AGN–galaxy regions.
2.5. Clustering analysis
We quantified the large-scale environments of AGNs using the projected AGN–galaxy cross-correlation function, wp(rp), following the methodology described in Paper I (see also Mountrichas et al. 2009; Mountrichas & Georgakakis 2012; Mountrichas et al. 2013, 2016). The cross-correlation approach reduces statistical uncertainties relative to the AGN autocorrelation and avoids the need to model the complex AGN selection function through random catalogues.
We stress that this methodology does not assume that AGN pairs are a subset of galaxy pairs, nor that AGN share the same halo occupation as inactive galaxies. The AGN bias was inferred from the AGN–galaxy cross-correlation relative to the galaxy autocorrelation in the linear two-halo regime, under the assumption of scale-independent bias on large scales. Any difference in halo occupation between AGN and matched galaxies would therefore manifest as a difference in the large-scale clustering amplitude.
The projected correlation function was obtained by integrating the redshift-space correlation function along the line of sight, adopting the same πmax values as in Paper I. Uncertainties were estimated via Jackknife resampling, and covariance matrices were computed following Ross et al. (2008).
We derived the AGN bias by fitting the measured wp(rp) to the linear-theory dark matter prediction on scales 4 < rp < 30 h−1 Mpc, where the two-halo term dominates. Halo masses were then inferred using the Sheth et al. (2001) bias–mass relation with the Eisenstein & Hu (1998) transfer function. As in Paper I, we fitted only the two-halo term of the correlation function, as the available AGN samples do not contain sufficient numbers of pairs to robustly constrain the one-halo term.
2.6. Matched subsamples and parameter control
To investigate whether the AGNs of MBH inhabit different large-scale environments from non-AGN galaxies with comparable host properties, we compared AGNs in specific MBH intervals with carefully constructed control samples. A central challenge is that SMBH mass correlates strongly with several host-galaxy quantities, i.e. M★, SFR, and sSFR, all of which are known to influence galaxy clustering (e.g. Mountrichas et al. 2019; Allevato et al. 2019). Our aim is to compare AGNs in a given MBH interval with non-active galaxies that share the same host-galaxy properties. Although the MBH − M★ relation provides a statistical mapping between MBH and M★, the matching was performed directly on the measured M★, SFR, and sSFR of each AGN. In this way, the control galaxies reproduce the empirical host-property distributions of the AGN subsamples, rather than relying on the precise calibration of the global scaling relation. By removing these dominant host-driven dependencies, the matching procedure allows us to isolate whether the presence of an actively accreting SMBH is associated with a distinct large-scale environment relative to inactive galaxies of similar stellar mass and star-formation properties. We emphasise that the clustering comparison was performed at fixed observed host-galaxy properties. Any uncertainty or intrinsic scatter in the MBH − M★ relation therefore did not directly propagate into the environmental measurement.
We employed the multivariate nearest-neighbour matching algorithm introduced in Paper I. The method operates in a standardised multi-dimensional parameter space and performs one-to-one matching without replacement. A caliper of 1.2 (in normalised units) is applied to limit the maximum permitted distance between potential matches. This value provides an effective compromise between sample size and matching precision: smaller calipers reduce the number of usable AGNs, while larger ones degrade the covariate balance.
Guided by our previous analyses of how the environment depends on host-galaxy and SMBH properties, we matched AGNs to non-AGN galaxies in log M★, logSFR, and logsSFR. Including the sSFR as an explicit matching variable improves control over the star-formation state of the galaxies in the presence of finite matching tolerances and intrinsic measurement scatter. This helps minimise residual environmental trends that correlate strongly with sSFR.
We experimented with simpler approaches, such as matching only on M★ or applying fixed threshold cuts, but these resulted in significantly smaller subsamples and poorer consistency across covariates. The multivariate matching adopted here therefore provides the most robust and statistically efficient framework for isolating environmental trends associated with SMBH mass.
3. The MBH–M★ relation and definition of AGN and galaxy subsets
In this section, first we examine the MBH − M★ relation of our X-ray AGN samples. Then, we define the subsets used in the clustering analysis.
3.1. The MBH–M★ relation
We first examined the distribution of AGNs in the log MBH − log M★ plane in order to characterise the empirical mapping between MBH and M★ within our XMM–XXL and Stripe 82X samples. Figure 1 presents three complementary views: (i) the full AGN distribution in the MBH − M★ plane, (ii) median log MBH values in bins of M★, and (iii) the behaviour of the mass ratio MBH/M★ as a function of M★.
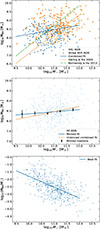 |
Fig. 1. Relation between MBH and M★. Top: log MBH − log M★ relation for the XXL and Stripe 82X AGN samples, together with the best-fitting linear trend for the combined dataset and the reference relations of Häring & Rix (2004) and Kormendy & Ho (2013). Middle: Median log MBH − log M★ values in M★ bins (black points with bootstrap uncertainties), together with the corresponding binned fit and, for comparison, the unbinned combined fit from the top panel; the full AGN sample is shown in the background. Bottom: log(MBH/M★) as a function of M★ for the combined AGN sample, with the best-fitting linear relation overplotted. |
The top panel shows that the AGNs populate a broad locus in the MBH − M★ plane, with substantial intrinsic scatter (≳0.4 dex) and no sharply defined ridge line. The distribution lies between the local dynamical relations of Häring & Rix (2004) and Kormendy & Ho (2013), but exhibits a noticeably flatter trend across the stellar-mass range 10 ≲ log(M★/M⊙)≲12.
Fitting a linear model of the form
 (1)
(1)
to the combined sample yields
 (2)
(2)
The fit was performed in log MBH − log M★ space using ordinary least squares, with uncertainties estimated via bootstrap resampling. We emphasise that this relation provides a statistical description of the present AGN sample rather than a calibration of the intrinsic SMBH–host scaling relation. Single-epoch virial masses carry typical uncertainties of ∼0.3 − 0.5 dex, and the X-ray flux limit suppresses low-mass black holes at low M★, both of which can flatten the observed slope relative to local dynamical measurements.
When fitted separately, the two survey fields show modest but non-negligible differences in slope. For XXL we obtained a shallower relation, bXXL = 0.12 ± 0.07, whereas Stripe 82X yields bS82X = 0.21 ± 0.06. This behaviour is consistent with the different dynamic ranges sampled by the two surveys: the XXL subset probes a narrower range in MBH and is therefore more sensitive to the effects of scatter and sample truncation, while Stripe 82X spans a broader range and recovers a somewhat steeper trend. This comparison illustrates that the inferred MBH − M★ scaling is sensitive to sample selection and mass coverage.
To better trace the central tendency, we computed median log MBH values in 0.5 dex bins of M★ (middle panel). The corresponding binned fit yields
 (3)
(3)
slightly flatter than the unbinned result, as expected when medians reduce the influence of the upper envelope of overmassive systems. For comparison, the unbinned combined fit from the top panel is also shown in the middle panel. Together, these approaches indicate the presence of a broad but shallow positive correlation over the explored mass range.
The bottom panel shows the behaviour of the mass ratio:
 (4)
(4)
with
 (5)
(5)
The negative slope largely reflects the shallow MBH − M★ trend discussed above. In the limit where MBH varies only weakly with M★, a declining MBH/M★ ratio with increasing M★ follows naturally. Therefore, this panel does not provide independent information beyond the scaling shown in the upper panels, but offers an alternative representation of the same behaviour.
For the purposes of this work, the MBH − M★ relation serves primarily as a convenient empirical reference for organising the sample and defining relative deviations. The environmental analysis presented below was performed at fixed observed host-galaxy properties and therefore does not depend on the precise slope or normalisation of this fit.
3.2. AGN classification and construction of galaxy control samples
We used the empirical MBH − M★ relation described above to organise the AGN sample for the clustering analysis. The primary goal of this paper is to compare AGNs of a given MBH with non-AGN galaxies that share the same observed host-galaxy properties. For this reason, the analysis is defined first in terms of MBH bins, rather than in terms of regions parallel to the MBH − M★ relation.
We focused on two MBH intervals with sufficient statistics:

These bins were chosen because they contain enough AGNs for meaningful clustering measurements, while still allowing us to examine whether AGNs and inactive galaxies differ in environment at fixed black-hole mass.
Within each MBH bin, we used the best-fitting global relation,
 (6)
(6)
as a reference to quantify whether individual AGNs lie on, above, or below the mean MBH − M★ trend. We stress that this relation was not used to impose hard stellar-mass cuts on the galaxy sample. Instead, the clustering comparison was performed directly at fixed observed M★, SFR, and sSFR through the multivariate matching described below.
Given the substantial intrinsic scatter of the MBH − M★ relation (∼0.4 − 0.5 dex), we did not select galaxies based on a narrow predicted M★ range. Control samples were instead constructed via the multivariate nearest-neighbour matching scheme described in Sect. 2.6. We performed one-to-one matching in standardised log M★, logSFR, and logsSFR space, ensuring that AGN and control galaxies share the same distributions in the host properties most strongly linked to halo occupation.
To characterise deviations from the mean relation, we defined

and classified AGNs as:
-
On–relation: |Δlog MBH|≤0.3 dex,
-
Overmassive: Δlog MBH > 0.3 dex,
-
Undermassive: Δlog MBH < −0.3 dex.
The ±0.3 dex threshold was chosen to identify meaningful offsets from the mean trend, while remaining comparable to typical single-epoch virial mass uncertainties (e.g. Vestergaard & Peterson 2006; Shen et al. 2011). This classification is intended primarily for qualitative interpretation rather than for clustering measurements.
For the clustering analysis, we retained only the on–relation AGNs within each MBH bin. The overmassive and undermassive subsets are too small for robust clustering: in the 8.0 − 8.5 bin there are 31 undermassive AGN and no overmassive systems, while in the 8.5 − 9.0 bin there are 45 overmassive AGNs and no undermassive systems. Tables 2 and 3 summarise the properties of the on–relation AGNs and their matched controls, as well as of the overmassive and undermassive subsets.
Median properties of the on–relation AGNs, their matched galaxy controls, and the overmassive and undermassive subsets in the 8.0 ≤ log(MBH/M⊙) < 8.5 bin.
Median properties of the on–relation AGNs, their matched galaxy controls, and the overmassive and undermassive subsets in the 8.5 ≤ log(MBH/M⊙) < 9.0 bin.
The apparent asymmetry between bins reflects the shallow slope and intrinsic scatter of the empirical MBH − M★ relation combined with the selection of broad-line, flux-limited AGNs, rather than a breakdown of the adopted scaling. Defining overmassive and undermassive systems globally across the full sample, without first separating in MBH, would mix objects with very different MBH and would not address the central question of this work; namely, whether AGNs and inactive galaxies differ in environment at fixed MBH. Likewise, a percentile-based classification within M★ bins would produce bin-dependent definitions and would no longer isolate departures from a common global SMBH–host relation. We therefore adopted fixed MBH bins for the clustering analysis and used the global relation as a common reference for defining relative offsets within those bins.
3.3. Properties and interpretation of overmassive and undermassive AGNs
Although the overmassive and undermassive subsets are too small for clustering, their median properties provide useful context for interpreting the scatter in the MBH − M★ plane. By construction, overmassive AGNs lie above the mean MBH − M★ relation and therefore reside in hosts with lower M★ at fixed MBH. Importantly, these systems also exhibit elevated sSFR. In the high-MBH bin, for example, the median log sSFR of the overmassive subset is higher by 0.64 dex than that of the on–relation AGNs (0.26 versus −0.38; Table 3), indicating that their hosts are, on average, more actively star-forming.
To visualise how star-formation state maps onto the MBH − M★ distribution, Fig. 2 shows the full AGN sample colour-coded by sSFR, together with the best-fitting relation and the ±0.3 dex boundaries used to define the three subsets. Higher-sSFR objects preferentially populate the low-M★ side of the relation at fixed MBH, consistent with the elevated sSFR measured for the overmassive subset.
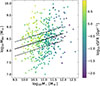 |
Fig. 2. Distribution of the AGN sample in the log MBH − log M★ plane colour-coded by log sSFR (in Gyr−1). The solid black line shows the best-fitting empirical MBH − M★ relation, while the dashed lines indicate the ±0.3 dex thresholds used to define the on–relation, overmassive, and undermassive subsets. |
However, we note that this behaviour may also reflect the well-known M★ dependence of galaxy star-formation activity. In particular, more massive galaxies are preferentially quiescent, while lower-mass systems tend to be actively star-forming. As a result, part of the observed sSFR gradient across the MBH − M★ plane may be driven by this underlying M★ sequence rather than by a direct dependence on SMBH mass. Indeed, at fixed M★ ∼ 1011 M⊙, the AGN hosts in our sample broadly separate into star-forming and quiescent populations, with no obvious additional dependence on MBH.
This behaviour is in contrast with the trends reported by Terrazas et al. (2016, 2017), who found that galaxies hosting overmassive black holes tend to have lower sSFRs. In our sample, we observe the opposite behaviour, with overmassive AGNs exhibiting higher sSFRs. We attribute this discrepancy primarily to differences in sample selection. The Terrazas et al. studies focus on the general galaxy population, including quiescent systems, whereas our sample is restricted to actively accreting broad-line X-ray AGNs. As a result, our selection preferentially includes systems with ongoing star formation and detectable accretion, while lower-sSFR, weakly accreting systems are underrepresented.
Consistent with this interpretation, even the on–relation AGNs and their matched control galaxies in the higher-MBH bin exhibit lower median sSFRs than their counterparts in the lower-MBH bin (Tables 2 and 3), indicating that the overall host population becomes less star-forming towards higher black-hole masses.
Undermassive AGNs, conversely, occupy more massive and less star-forming hosts. In the lower-MBH bin, the undermassive subset has a median log M★ = 11.28, compared to 10.93 for the on–relation AGNs, and a median log sSFR = −0.50, lower by 0.50 dex than the on–relation population (Table 2). What is not guaranteed by the definition, however, is how their instantaneous accretion rates compare to those of on–relation systems. In our sample, the undermassive AGNs in the lower-MBH bin have a median log λEdd = −1.17, higher by 0.19 dex than the on–relation AGNs in the same bin. More generally, comparing the two extreme subsets across the two bins shows that the median sSFR differs by 0.76 dex and the median λEdd by 0.52 dex between the undermassive and overmassive populations (Tables 2 and 3). This suggests that the connection between star formation and accretion is non-trivial and not simply encoded by the position relative to the mean relation.
We quantified the link between star formation and accretion by testing for a correlation between sSFR and λEdd. We find a weak but statistically significant correlation for the full AGN sample (Spearman ρ ≃ 0.22), while the correlation is stronger within the on–relation and overmassive subsets (ρ ≃ 0.5) and weaker for the undermassive population. This behaviour is consistent with partially coupled, but scatter-dominated, growth, in which episodes of enhanced accretion can coincide with elevated star formation but do not do so universally.
These contrasting behaviours motivate two schematic growth pathways, which we treat as qualitative interpretations rather than a deterministic evolutionary sequence:
-
Black-hole–leading episodes (overmassive): systems temporarily scattered above the mean relation, often associated with a higher sSFR at a fixed MBH.
-
Host–leading episodes (undermassive): systems temporarily scattered below the mean relation, for which a comparatively high λEdd suggests that the SMBH may be in a phase of catching up.
This interpretation is consistent with our previous results. In Mountrichas (2023), we showed that X-ray selected AGN tend to lie above the mean MBH − M★ relation on average, a natural consequence of flux-limited selection, which preferentially identifies systems with higher X-ray luminosities at fixed host-galaxy properties. We stress that the overmassive and undermassive classifications are statistical in nature: given the combined random and systematic uncertainties of single-epoch black-hole mass estimates (∼0.3 − 0.5 dex), the two subsets are expected to overlap substantially. As a result, individual sources may scatter across the adopted ±0.3 dex threshold without implying a true physical transition.
In Mountrichas et al. (2025), we further demonstrated in dwarf galaxies that MBH/M★ declines with increasing M★, consistent with early rapid black-hole growth followed by prolonged M★ assembly. The undermassive AGNs identified here do not contradict this overall tendency. Rather, they are consistent with stochastic SMBH growth scenarios in which systems can temporarily scatter below the mean MBH − M★ relation and may subsequently experience phases of enhanced accretion. Related ideas have also been discussed by Terrazas et al. (2025) (see also Roberts et al. 2026), who emphasised the diversity of black-hole growth histories and the importance of considering host-galaxy state when interpreting offsets from mean SMBH scaling relations. Given that the AGN and control samples are matched in M★, SFR, and sSFR, and that the observed accretion–star-formation coupling is scatter-dominated, this interpretation should be regarded as suggestive rather than conclusive.
A number of observational studies support the existence of host–leading episodes in which stellar mass assembly precedes significant SMBH growth. Analyses of SDSS AGNs by Kauffmann & Heckman (2009) show that some massive, already-assembled galaxies host black holes that are undermassive relative to their stellar mass, consistent with delayed accretion episodes. Similar undermassive SMBHs have been identified in quenched or quenching systems (Greene et al. 2020; Suh et al. 2020), as well as in intermediate-mass galaxies where early star formation precedes late-time black-hole growth (Li et al. 2021). Studies of low-mass AGNs also reveal undermassive black holes that may reflect early stellar assembly followed by a later phase of SMBH accretion (Reines & Volonteri 2015). Together, these works support non-synchronous growth in which the host galaxy and SMBH can evolve on partially decoupled timescales.
The coexistence of overmassive and undermassive systems also agrees with predictions from cosmological hydrodynamic simulations (e.g. Habouzit et al. 2017; Anglés-Alcázar et al. 2017; Dubois et al. 2021), which show that SMBH and galaxy growth proceed in bursty, decoupled episodes that naturally produce large intrinsic scatter in the MBH − M★ plane. Semi-empirical and continuity-equation models (e.g. Shankar et al. 2013, 2016, 2020, 2025; Aversa et al. 2016; Roberts et al. 2026) predict that duty-cycle effects, halo assembly history, and stochastic gas inflows generate large intrinsic scatter in the MBH − M★ plane, consistent with the coexistence of overmassive and undermassive systems in flux-limited AGN samples. Our findings therefore reinforce the view that the observed MBH − M★ distribution in AGN-selected samples reflects a combination of intrinsic diversity, stochastic growth, and selection effects.
4. Clustering of AGNs versus non-AGN galaxies at fixed host-galaxy properties inferred from the MBH–M★ relation
In this section, we present the dark-matter halo (DMH) mass measurements for AGNs and non–AGN galaxies that are matched in host-galaxy properties and discuss our findings.
4.1. Clustering measurements
First, we present the DMH mass measurements for AGNs and non-AGN galaxies that are matched in host-galaxy properties inferred from the MBH − M★ relation. The AGN halo masses were derived from the AGN–galaxy cross-correlation functions, using the galaxy bias inferred from galaxy–galaxy cross-correlations.
We estimated the environments of the matched galaxy control samples using galaxy–galaxy cross-correlation functions, adopting the same full galaxy population as tracer as in Paper I. In this framework, the matched galaxies defined here are cross-correlated with the parent galaxy samples, ensuring that the tracer selection, random catalogues, and clustering methodology are identical to those used in Paper I. For this reason, we do not repeat the methodological details or the corresponding measurements here. For reference, the DMH mass of the combined XXL+Stripe 82X AGN sample was found to be log(MDMH/[h−1 M⊙]) = 12.74 ± 0.16 (Paper I).
Figure 3 shows the AGN–galaxy cross-correlation functions alongside the galaxy–galaxy cross-correlation functions of the matched control samples, together with their best-fitting two-halo models. The top panel corresponds to AGNs with 8.0 ≤ log(MBH/M⊙) < 8.5, and the bottom panel to AGNs with 8.5 ≤ log(MBH/M⊙) < 9.0. All fits were performed over scales of 5 ≤ rp ≤ 30 h−1 Mpc, since on smaller scales the number of AGN–galaxy pairs becomes too small for statistically meaningful constraints.
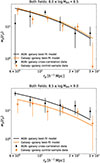 |
Fig. 3. Projected AGN–galaxy cross-correlation functions compared with the galaxy–galaxy cross-correlations of the matched control samples for the two black-hole mass intervals analysed in this work. |
For the lower black-hole mass bin (8.0 − 8.5), the inferred halo masses of AGNs and control galaxies are consistent within the uncertainties, with log(Mhalo/M⊙) = 13.04 ± 0.27 for AGNs and 12.95 ± 0.15 for the sources in the control sample. In the higher MBH bin (8.5 − 9.0), AGNs appear to reside in somewhat more massive halos, with log(Mhalo/M⊙) = 13.53 ± 0.37 compared to 13.16 ± 0.27 for the matched non-AGN galaxies. Although the best-fitting halo masses differ by ∼0.4 dex, the measurements remain consistent within the quoted uncertainties. The projected correlation functions of AGNs and control galaxies exhibit broadly similar amplitudes and shapes, with most data points overlapping within their error bars across the fitted scales.
We therefore regard the inferred halo-mass difference in this bin as marginal and sensitive to statistical fluctuations, rather than as a definitive detection. Notably, both AGNs and control galaxies in this regime inhabit group-scale DMHs. If real, the observed offset would suggest that AGNs hosting the most massive black holes preferentially occupy the higher-mass end of the group-halo population relative to non-AGN galaxies matched in M★, SFR, and sSFR. Given the current uncertainties, the relative halo-mass offset between AGNs and control galaxies within the group regime should be regarded as tentative.
4.2. Interpretation of the clustering results
The halo-mass measurements presented in Fig. 3 reveal two regimes. The AGNs with 8.0 ≤ log(MBH/M⊙) < 8.5 reside in halos with log(Mhalo/M⊙) = 13.04 ± 0.27, statistically indistinguishable from the log(Mhalo/M⊙) = 12.95 ± 0.15 measured for their matched non-AGN galaxies. Given that AGNs and control galaxies are matched in M★, SFR, and sSFR, quantities known to correlate with large-scale bias and halo occupation (e.g. Georgakakis et al. 2014; Aird et al. 2019; Mountrichas et al. 2019; Allevato et al. 2019), this result indicates that, at moderate MBH, the presence of an actively accreting SMBH does not correspond to a distinct large-scale environment once host-galaxy properties are controlled.
In contrast, in the higher-mass bin 8.5 ≤ log(MBH/M⊙) < 9.0, we find a marginal indication of a higher characteristic halo mass for AGNs compared to the matched non-AGN galaxies. The best-fitting values are log(Mhalo/M⊙) = 13.53 ± 0.37 for AGNs and 13.16 ± 0.27 for the control sample. Although the difference is ∼0.4 dex, the measurements remain formally consistent within the uncertainties, and the projected correlation functions show broadly similar amplitudes and shapes. We therefore regard this offset as suggestive rather than conclusive.
At face value, the emerging pattern is consistent with a scenario in which environmental effects become increasingly relevant only in the high–MBH regime. Several studies have reported enhanced AGN fractions in group and cluster environments (e.g. Martini et al. 2007, 2009, 2013), while more recent analyses and modelling (e.g. Georgakakis et al. 2024; Muñoz Rodríguez et al. 2024) suggest that AGN triggering in dense environments cannot be fully explained by an λEdd distribution that is independent of halo mass. In this context, the mild halo-mass excess detected here may reflect the increasing importance of halo-driven processes at the high-mass end of the SMBH population.
To assess whether structural differences may contribute to this signal, we examined available DESI Legacy Survey morphological parameters. In particular, we considered the single-component Sérsic index (SERSIC), the semi-major-axis size proxy (SHAPE_R), and the TYPE classification provided in the DESI catalogues (Euclid Collaboration: Quilley et al. 2026; Euclid Collaboration: Romelli et al. 2026). The Sérsic index traces the concentration of the surface-brightness profile, increasing from disc-dominated systems (n ∼ 1) to bulge-dominated systems (n ≳ 4), while SHAPE_R provides a model-independent estimate of the apparent size. The TYPE flag broadly classifies sources as PSF (compact or unresolved), disc-like, bulgy, or irregular systems.
DESI morphological information is available for 15 AGNs and 113 matched galaxies in the 8.0 ≤ log(MBH/M⊙) < 8.5 bin, and for 8 AGNs and 85 matched galaxies in the 8.5 ≤ log(MBH/M⊙) < 9.0 bin. The smaller number of AGNs with reliable DESI measurements reflects the seeing-limited depth of the Legacy imaging and the compactness of some AGN hosts.
In the lower MBH bin, no clear structural differences are apparent between AGN and matched galaxies, consistent with their indistinguishable halo masses. In the higher MBH bin, we find a qualitative indication that AGN hosts tend to be more compact than their control counterparts. Figure 4 illustrates this comparison for the high-MBH matched samples using the cumulative distributions of SERSIC and SHAPE_R. The SHAPE_R distributions suggest that AGN hosts occupy the smaller-size part of the distribution, whereas the Sérsic-index comparison is less conclusive, likely because unresolved nuclear emission can bias single-component profile fits. Given the limited statistics and the seeing-limited nature of the imaging, this comparison is necessarily qualitative. Nevertheless, it is consistent with the idea that, at fixed M★ and SFR, structural differences may correlate with both halo mass and SMBH mass in the high-mass regime.
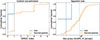 |
Fig. 4. Cumulative distributions of SERSIC (left) and SHAPE_R (right) for AGNs and matched control galaxies in the 8.5 ≤ log(MBH/M⊙) < 9.0 bin. The vertical lines indicate the sample medians. Owing to the small number of AGNs with reliable DESI morphology, especially for SHAPE_R, this comparison is intended as a qualitative illustration only. |
Supermassive black holes above ∼108.5 M⊙ are frequently associated with bulge-dominated or transitioning systems with high central densities (e.g. Kormendy & Ho 2013; Greene et al. 2020; Ding et al. 2020). Such galaxies preferentially inhabit group-scale halos where quenching and virial-shock heating become efficient at Mhalo ∼ 1012.5 − 1013 M⊙ (e.g. Birnboim & Dekel 2003; Dekel & Birnboim 2006). If the tentative halo-mass excess observed here is real, it may therefore reflect the coupling between bulge assembly, halo potential depth, and SMBH growth that becomes prominent only at the massive end.
Finally, we emphasise that these results are fully consistent with Paper I. Paper I showed that among X-ray AGNs, large-scale bias does not vary systematically with MBH over the range probed. The present work addresses a different question: whether AGNs occupy different halos than inactive galaxies with the same stellar and star-formation properties. The two results are therefore compatible. Within the AGN population, halo mass does not depend strongly on MBH; however, when high-mass AGNs are compared to non-active galaxies at fixed host properties, a possible halo-related difference emerges only in the highest MBH bin.
Hydrodynamic simulations (e.g. Anglés-Alcázar et al. 2017; Habouzit et al. 2017; Dubois et al. 2021) and semi-empirical models (e.g. Shankar et al. 2013, 2016, 2020) predict that above MBH ∼ 108.3 − 108.5 M⊙ SMBH growth becomes increasingly sensitive to halo assembly and merger history, naturally producing enhanced scatter and mild environmental trends. Our measurements are consistent with this expectation, while remaining limited by current statistics. Future wide-area surveys with improved depth and morphology, such as Euclid, will be required to determine whether the high-mass halo excess represents a genuine physical transition or a statistical fluctuation.
5. Summary
In this work we investigated the connection between SMBHs, their host galaxies, and large-scale DMHs by combining broad-line X-ray AGNs from the XMM–XXL North and Stripe 82X surveys with galaxy samples from VIPERS and SDSS/Stripe 82. These datasets were described extensively in Paper I, where we explored AGN clustering as a function of SMBH properties. Here, we address a complementary question: whether AGNs with a given MBH occupy the same or different large-scale environments as non-AGN galaxies with statistically indistinguishable host-galaxy properties.
We first characterised the empirical MBH − M★ distribution of the combined AGN sample. While a shallow scaling between MBH and M★ is present in the data, the intrinsic scatter is large, and the observed distribution is influenced by flux-limited AGN selection and virial-mass uncertainties. The mass ratio MBH/M★ decreases with increasing M★ within the sampled range, consistent with previous AGN studies and with continuity-equation and semi-empirical models of SMBH growth (e.g. Aversa et al. 2016; Shankar et al. 2016, 2020). We stress that this relation serves primarily as an empirical characterisation of the sample and as a bookkeeping device for defining subsamples, rather than as a precise measurement of the intrinsic galaxy scaling relation.
Using this empirical relation, we classified AGNs into on-relation, overmassive, and undermassive subsets based on their deviations from the best-fitting trend. Although the overmassive and undermassive subsets are too small for clustering analysis, their median properties provide qualitative insight into SMBH–host co-evolution. Overmassive AGNs reside in lower-M★ hosts at fixed MBH and exhibit elevated sSFR, indicating ongoing stellar mass assembly. Undermassive AGNs occupy more massive, lower-sSFR hosts and show comparatively high median λEdd, suggestive of enhanced accretion episodes. The correlation between sSFR and λEdd is weak for the full sample but stronger within certain subsets, indicating partially coupled, scatter-dominated growth rather than a one-to-one correspondence. These trends are broadly consistent with stochastic, non-synchronous growth scenarios predicted by simulations and semi-empirical models (e.g. Aversa et al. 2016; Shankar et al. 2016, 2020).
For the clustering analysis, we selected AGNs in two black-hole mass intervals,

and constructed galaxy control samples matched in M★, SFR, and sSFR using the multivariate nearest-neighbour algorithm introduced in Paper I. This procedure ensures that AGNs and non-AGN galaxies compared at fixed black-hole mass share the same distributions in the host properties known to correlate with halo occupation.
We measured AGN–galaxy cross-correlation functions for each black-hole mass bin and compared them to the galaxy autocorrelation of the matched controls. For moderate SMBH masses (8.0 ≤ log MBH < 8.5), we find no measurable halo-mass difference between AGNs and inactive galaxies once host properties are controlled. This indicates that, in this regime, the presence of an actively accreting SMBH does not correspond to a distinct large-scale environment.
In the higher-mass bin (8.5 ≤ log MBH < 9.0), we find a mild indication of a higher characteristic halo mass for AGNs relative to the matched non-AGN galaxies. The inferred difference is ∼0.4 dex but remains formally consistent within the uncertainties. We therefore interpret this signal as suggestive rather than conclusive. If real, it may indicate that environmental or halo-scale processes become increasingly relevant only at the highest black-hole masses, consistent with observational studies of AGNs in group and cluster environments (e.g. Martini et al. 2007, 2013) and with recent modelling that suggests AGN triggering may depend on halo mass beyond what is captured by an environment-independent λEdd distribution (e.g. Georgakakis et al. 2024; Muñoz Rodríguez et al. 2024).
Morphological information from DESI Legacy imaging suggests that, in the high–MBH bin, AGN hosts may be more compact than their matched counterparts, while the evidence of enhanced central concentration is less conclusive. The limited statistics and seeing-limited resolution imply that this comparison remains qualitative.
These results are fully consistent with Paper I, which found no detectable dependence of AGN clustering on MBH when comparing AGNs to one another at fixed host properties. The present analysis suggests that, within the AGN population, halo mass does not vary systematically with MBH. However, when high-mass AGNs are compared to non-AGN galaxies at fixed host properties, a possible halo-related difference emerges only in the highest mass regime.
Looking ahead, current and upcoming wide-area spectroscopic surveys, including Euclid, 4MOST, MOONS, WEAVE, the SDSS-V ‘Black Hole Mapper’, and, on longer timescales, the Roman Space Telescope, will dramatically increase the number of AGNs and inactive galaxies with homogeneous measurements of SMBH mass and host-galaxy structure. These datasets will reduce statistical uncertainties, extend the dynamic range in MBH, and enable more definitive tests of how SMBH growth, host-galaxy evolution, and halo environment co-evolve across cosmic time.
Acknowledgments
GM acknowledges funding from grant PID2021-122955OB-C41 funded by MCIN/AEI/10.13039/501100011033 and by “ERDF/EU”. This work was partially supported by the European Union’s Horizon 2020 Research and Innovation program under the Maria Sklodowska-Curie grant agreement (No. 754510). This publication is part of the R&D&I project PID2024-155779OB-C31, funded by MICIU/AEI/10.13039/501100011033 and co-funded by FEDER, EU. We also acknowledge partial support from the European Union’s Horizon 2020 research and innovation programme under the Marie Skłodowska-Curie grant agreement No 860744 (Bid4BESt; grant coordinator F. Shankar).
References
- Aird, J., Coil, A. L., & Georgakakis, A. 2019, MNRAS, 484, 4360 [NASA ADS] [CrossRef] [Google Scholar]
- Allevato, V., Finoguenov, A., Cappelluti, N., et al. 2011, ApJ, 736, 99 [NASA ADS] [CrossRef] [Google Scholar]
- Allevato, V., Civano, F., Finoguenov, A., et al. 2016, ApJ, 832, 70 [Google Scholar]
- Allevato, V., Viitanen, A., Finoguenov, A., et al. 2019, A&A, 632, A88 [NASA ADS] [CrossRef] [EDP Sciences] [Google Scholar]
- Anglés-Alcázar, D., Davé, R., Faucher-Giguère, C.-A., Özel, F., & Hopkins, P. F. 2017, MNRAS, 464, 2840 [Google Scholar]
- Aversa, R., Lapi, A., de Zotti, G., Shankar, F., & Danese, L. 2016, MNRAS, 459, 2138 [Google Scholar]
- Birnboim, Y., & Dekel, A. 2003, MNRAS, 345, 349 [Google Scholar]
- Boquien, M., Burgarella, D., Roehlly, Y., et al. 2019, A&A, 622, A103 [NASA ADS] [CrossRef] [EDP Sciences] [Google Scholar]
- Buat, V., Mountrichas, G., Yang, G., et al. 2021, A&A, 654, A93 [NASA ADS] [CrossRef] [EDP Sciences] [Google Scholar]
- Coil, A. L., Georgakakis, A., Newman, J. A., et al. 2009, ApJ, 701, 1484 [NASA ADS] [CrossRef] [Google Scholar]
- Comparat, J., Luo, W., Merloni, A., et al. 2023, A&A, 673, A122 [NASA ADS] [CrossRef] [EDP Sciences] [Google Scholar]
- Dekel, A., & Birnboim, Y. 2006, MNRAS, 368, 2 [NASA ADS] [CrossRef] [Google Scholar]
- Ding, X., Silverman, J., Treu, T., et al. 2020, ApJ, 888, 37 [NASA ADS] [CrossRef] [Google Scholar]
- Dubois, Y., Beckmann, R., Bournaud, F., et al. 2021, A&A, 651, A109 [NASA ADS] [CrossRef] [EDP Sciences] [Google Scholar]
- Eisenstein, D. J., & Hu, W. 1998, ApJ, 496, 605 [Google Scholar]
- Euclid Collaboration (Romelli, E., et al.) 2026, A&A, in press, https://doi.org/10.1051/0004-6361/202554586 [Google Scholar]
- Euclid Collaboration (Quilley, L., et al.) 2026, A&A, 711, A8 [Google Scholar]
- Garilli, B., Guzzo, L., Scodeggio, M., et al. 2014, A&A, 562, A23 [NASA ADS] [CrossRef] [EDP Sciences] [Google Scholar]
- Georgakakis, A., Mountrichas, G., Salvato, M., et al. 2014, MNRAS, 443, 3327 [Google Scholar]
- Georgakakis, A., Buchner, J., Ruiz, A., et al. 2024, MNRAS, 531, 4524 [Google Scholar]
- Gilli, R., Daddi, E., Zamorani, G., et al. 2005, A&A, 430, 811 [NASA ADS] [CrossRef] [EDP Sciences] [Google Scholar]
- Greene, J. E., Strader, J., & Ho, L. C. 2020, ARA&A, 58, 257 [Google Scholar]
- Habouzit, M., Volonteri, M., & Dubois, Y. 2017, MNRAS, 468, 3935 [NASA ADS] [CrossRef] [Google Scholar]
- Häring, N., & Rix, H.-W. 2004, ApJ, 604, L89 [Google Scholar]
- Kauffmann, G., & Heckman, T. M. 2009, MNRAS, 397, 135 [NASA ADS] [CrossRef] [Google Scholar]
- Kormendy, J., & Ho, L. C. 2013, ARA&A, 51, 511 [Google Scholar]
- Koutoulidis, L., Plionis, M., Georgantopoulos, I., & Fanidakis, N. 2013, MNRAS, 428, 1382 [NASA ADS] [CrossRef] [Google Scholar]
- Koutoulidis, L., Mountrichas, G., Georgantopoulos, I., Pouliasis, E., & Plionis, M. 2022, A&A, 658, A35 [NASA ADS] [CrossRef] [EDP Sciences] [Google Scholar]
- Krumpe, M., Lamer, G., Markowitz, A., & Corral, A. 2010, ApJ, 725, 2444 [NASA ADS] [CrossRef] [Google Scholar]
- Krumpe, M., Miyaji, T., Coil, A. L., & Aceves, H. 2012, ApJ, 746, 1 [NASA ADS] [CrossRef] [Google Scholar]
- Krumpe, M., Miyaji, T., Husemann, B., et al. 2015, ApJ, 815, 21 [NASA ADS] [CrossRef] [Google Scholar]
- Krumpe, M., Miyaji, T., Georgakakis, A., et al. 2023, ApJ, 952, 109 [NASA ADS] [CrossRef] [Google Scholar]
- LaMassa, S. M., Cales, S., Moran, E. C., et al. 2013a, MNRAS, 432, 135 [Google Scholar]
- LaMassa, S. M., Urry, C. M., Cappelluti, N., et al. 2013b, MNRAS, 436, 3581 [CrossRef] [Google Scholar]
- LaMassa, S. M., Cales, S., Moran, E. C., et al. 2015, ApJ, 800, 144 [NASA ADS] [CrossRef] [Google Scholar]
- LaMassa, S., Peca, A., Urry, C. M., et al. 2024, ApJ, 974, 235 [Google Scholar]
- Li, J., Silverman, J. D., Ding, X., et al. 2021, ApJ, 922, 142 [NASA ADS] [CrossRef] [Google Scholar]
- Liu, Z., Merloni, A., Georgakakis, A., et al. 2016, MNRAS, 459, 1602 [Google Scholar]
- Magorrian, J., Tremaine, S., Richstone, D., et al. 1998, AJ, 115, 2285 [Google Scholar]
- Marconi, A., & Hunt, L. K. 2003, ApJ, 589, L21 [Google Scholar]
- Martini, P., Mulchaey, J. S., & Kelson, D. D. 2007, ApJ, 664, 761 [NASA ADS] [CrossRef] [Google Scholar]
- Martini, P., Sivakoff, G. R., & Mulchaey, J. S. 2009, MNRAS, 393, 601 [Google Scholar]
- Martini, P., Miller, E. D., Brodwin, M., et al. 2013, ApJ, 768, 1 [Google Scholar]
- Masoura, V. A., Mountrichas, G., Georgantopoulos, I., et al. 2018, A&A, 618, 31 [Google Scholar]
- Masoura, V. A., Mountrichas, G., Georgantopoulos, I., & Plionis, M. 2021, A&A, 646, A167 [EDP Sciences] [Google Scholar]
- Mendez, A. J., Coil, A. L., Aird, J., et al. 2016, ApJ, 821, 55 [NASA ADS] [CrossRef] [Google Scholar]
- Menzel, M.-L., Merloni, A., Georgakakis, A., et al. 2016, MNRAS, 457, 110 [Google Scholar]
- Mountrichas, G. 2023, A&A, 672, A98 [NASA ADS] [CrossRef] [EDP Sciences] [Google Scholar]
- Mountrichas, G., & Buat, V. 2023, A&A, 679, A151 [NASA ADS] [CrossRef] [EDP Sciences] [Google Scholar]
- Mountrichas, G., & Georgakakis, A. 2012, MNRAS, 420, 514 [NASA ADS] [CrossRef] [Google Scholar]
- Mountrichas, G., & Georgantopoulos, I. 2024, A&A, 683, A160 [NASA ADS] [CrossRef] [EDP Sciences] [Google Scholar]
- Mountrichas, G., & Shankar, F. 2023, MNRAS, 518, 2088 [Google Scholar]
- Mountrichas, G., Sawangwit, U., Shanks, T., et al. 2009, MNRAS, 394, 2050 [Google Scholar]
- Mountrichas, G., Georgakakis, A., Finoguenov, A., et al. 2013, MNRAS, 430, 661 [NASA ADS] [CrossRef] [Google Scholar]
- Mountrichas, G., Georgakakis, A., Menzel, M.-L., et al. 2016, MNRAS, 457, 4195 [NASA ADS] [CrossRef] [Google Scholar]
- Mountrichas, G., Georgakakis, A., & Georgantopoulos, I. 2019, MNRAS, 483, 1374 [NASA ADS] [CrossRef] [Google Scholar]
- Mountrichas, G., Buat, V., Georgantopoulos, I., et al. 2021a, A&A, 653, A70 [NASA ADS] [CrossRef] [EDP Sciences] [Google Scholar]
- Mountrichas, G., Buat, V., Yang, G., et al. 2021b, A&A, 653, A74 [NASA ADS] [CrossRef] [EDP Sciences] [Google Scholar]
- Mountrichas, G., Buat, V., Yang, G., et al. 2022a, A&A, 663, A130 [NASA ADS] [CrossRef] [EDP Sciences] [Google Scholar]
- Mountrichas, G., Buat, V., Yang, G., et al. 2022b, A&A, 667, A145 [NASA ADS] [CrossRef] [EDP Sciences] [Google Scholar]
- Mountrichas, G., Masoura, V. A., Xilouris, E. M., et al. 2022c, A&A, 661, A108 [NASA ADS] [CrossRef] [EDP Sciences] [Google Scholar]
- Mountrichas, G., Yang, G., Buat, V., et al. 2023, A&A, 675, A137 [NASA ADS] [CrossRef] [EDP Sciences] [Google Scholar]
- Mountrichas, G., Masoura, V. A., Corral, A., & Carrera, F. J. 2024a, A&A, 683, A143 [NASA ADS] [CrossRef] [EDP Sciences] [Google Scholar]
- Mountrichas, G., Siudek, M., & Cucciati, O. 2024b, A&A, 686, A229 [NASA ADS] [CrossRef] [EDP Sciences] [Google Scholar]
- Mountrichas, G., Viitanen, A., Carrera, F. J., et al. 2024c, A&A, 683, A172 [NASA ADS] [CrossRef] [EDP Sciences] [Google Scholar]
- Mountrichas, G., Carrera, F. J., Georgantopoulos, I., et al. 2025, A&A, 700, A234 [NASA ADS] [CrossRef] [EDP Sciences] [Google Scholar]
- Mountrichas, G., Carrera, F. J., Shankar, F., & Georgakakis, A. 2026, A&A, 708, A323 [NASA ADS] [CrossRef] [EDP Sciences] [Google Scholar]
- Muñoz Rodríguez, I., Georgakakis, A., Shankar, F., et al. 2024, MNRAS, 532, 336 [CrossRef] [Google Scholar]
- Pierre, M., Pacaud, F., Adami, C., et al. 2016, A&A, 592, A1 [NASA ADS] [CrossRef] [EDP Sciences] [Google Scholar]
- Planck Collaboration VI. 2020, A&A, 641, A6 [NASA ADS] [CrossRef] [EDP Sciences] [Google Scholar]
- Pouliasis, E., Mountrichas, G., Georgantopoulos, I., et al. 2022, A&A, 667, A56 [NASA ADS] [CrossRef] [EDP Sciences] [Google Scholar]
- Powell, M. C., Urry, C. M., Cappelluti, N., et al. 2020, ApJ, 891, 41 [CrossRef] [Google Scholar]
- Reines, A. E., & Volonteri, M. 2015, ApJ, 813, 82 [NASA ADS] [CrossRef] [Google Scholar]
- Roberts, D., Shankar, F., & Cammelli, V. 2026, MNRAS, in press [arXiv:2601.23250] [Google Scholar]
- Ross, N. P., Shanks, T., Cannon, R. D., et al. 2008, MNRAS, 387, 1323 [Google Scholar]
- Scodeggio, M., Guzzo, L., Garilli, B., et al. 2018, A&A, 609, A84 [NASA ADS] [CrossRef] [EDP Sciences] [Google Scholar]
- Shankar, F., Weinberg, D. H., & Miralda-Escudé, J. 2013, MNRAS, 428, 421 [NASA ADS] [CrossRef] [Google Scholar]
- Shankar, F., Bernardi, M., Sheth, R. K., et al. 2016, MNRAS, 460, 3119 [NASA ADS] [CrossRef] [Google Scholar]
- Shankar, F., Allevato, V., Bernardi, M., et al. 2020, Nat. Astron., 4, 282 [Google Scholar]
- Shankar, F., Bernardi, M., Roberts, D., et al. 2025, MNRAS, 541, 2070 [Google Scholar]
- Shen, Y., Strauss, M. A., Ross, N. P., et al. 2009, ApJ, 697, 1656 [Google Scholar]
- Shen, Y., Richards, G. T., Strauss, M. A., et al. 2011, ApJS, 194, 45 [Google Scholar]
- Sheth, R. K., Mo, H. J., & Tormen, G. 2001, MNRAS, 323, 1 [NASA ADS] [CrossRef] [Google Scholar]
- Suh, H., Civano, F., Trakhtenbrot, B., et al. 2020, ApJ, 889, 32 [NASA ADS] [CrossRef] [Google Scholar]
- Terrazas, B. A., Bell, E. F., Woo, J.-H., Henriques, B. M. B., & White, S. D. M. 2016, ApJ, 830, L12 [NASA ADS] [CrossRef] [Google Scholar]
- Terrazas, B. A., Bell, E. F., Woo, J.-H., Henriques, B. M. B., & White, S. D. M. 2017, ApJ, 844, 170 [NASA ADS] [CrossRef] [Google Scholar]
- Terrazas, B. A., Aird, J., & Coil, A. L. 2025, ApJ, 993, 187 [Google Scholar]
- Vestergaard, M., & Peterson, B. M. 2006, ApJ, 641, 689 [Google Scholar]
- Yang, G., Boquien, M., Buat, V., et al. 2020, MNRAS, 491, 740 [Google Scholar]
- Yang, G., Boquien, M., Brandt, W. N., et al. 2022, ApJ, 927, 192 [NASA ADS] [CrossRef] [Google Scholar]
All Tables
Final number of AGN and galaxies used in the clustering analysis after all photometric, quality, and redshift cuts, restricted to the overlapping AGN–galaxy regions.
Median properties of the on–relation AGNs, their matched galaxy controls, and the overmassive and undermassive subsets in the 8.0 ≤ log(MBH/M⊙) < 8.5 bin.
Median properties of the on–relation AGNs, their matched galaxy controls, and the overmassive and undermassive subsets in the 8.5 ≤ log(MBH/M⊙) < 9.0 bin.
All Figures
|
Fig. 1. Relation between MBH and M★. Top: log MBH − log M★ relation for the XXL and Stripe 82X AGN samples, together with the best-fitting linear trend for the combined dataset and the reference relations of Häring & Rix (2004) and Kormendy & Ho (2013). Middle: Median log MBH − log M★ values in M★ bins (black points with bootstrap uncertainties), together with the corresponding binned fit and, for comparison, the unbinned combined fit from the top panel; the full AGN sample is shown in the background. Bottom: log(MBH/M★) as a function of M★ for the combined AGN sample, with the best-fitting linear relation overplotted. |
| In the text | |
|
Fig. 2. Distribution of the AGN sample in the log MBH − log M★ plane colour-coded by log sSFR (in Gyr−1). The solid black line shows the best-fitting empirical MBH − M★ relation, while the dashed lines indicate the ±0.3 dex thresholds used to define the on–relation, overmassive, and undermassive subsets. |
| In the text | |
|
Fig. 3. Projected AGN–galaxy cross-correlation functions compared with the galaxy–galaxy cross-correlations of the matched control samples for the two black-hole mass intervals analysed in this work. |
| In the text | |
|
Fig. 4. Cumulative distributions of SERSIC (left) and SHAPE_R (right) for AGNs and matched control galaxies in the 8.5 ≤ log(MBH/M⊙) < 9.0 bin. The vertical lines indicate the sample medians. Owing to the small number of AGNs with reliable DESI morphology, especially for SHAPE_R, this comparison is intended as a qualitative illustration only. |
| In the text | |
Current usage metrics show cumulative count of Article Views (full-text article views including HTML views, PDF and ePub downloads, according to the available data) and Abstracts Views on Vision4Press platform.
Data correspond to usage on the plateform after 2015. The current usage metrics is available 48-96 hours after online publication and is updated daily on week days.
Initial download of the metrics may take a while.