Open Access
Fig. 2.
Download original image
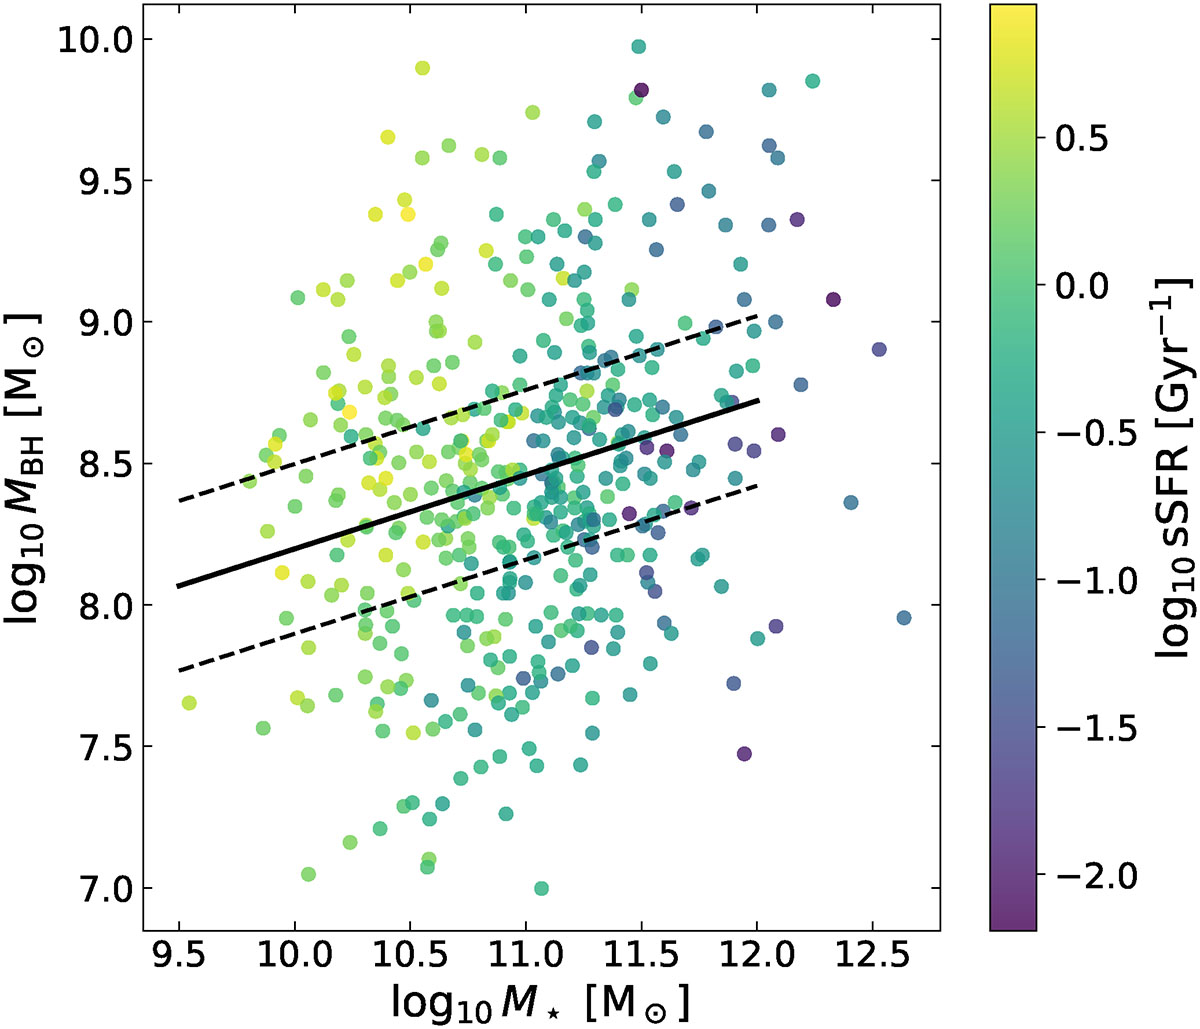
Distribution of the AGN sample in the log MBH − log M★ plane colour-coded by log sSFR (in Gyr−1). The solid black line shows the best-fitting empirical MBH − M★ relation, while the dashed lines indicate the ±0.3 dex thresholds used to define the on–relation, overmassive, and undermassive subsets.
Current usage metrics show cumulative count of Article Views (full-text article views including HTML views, PDF and ePub downloads, according to the available data) and Abstracts Views on Vision4Press platform.
Data correspond to usage on the plateform after 2015. The current usage metrics is available 48-96 hours after online publication and is updated daily on week days.
Initial download of the metrics may take a while.