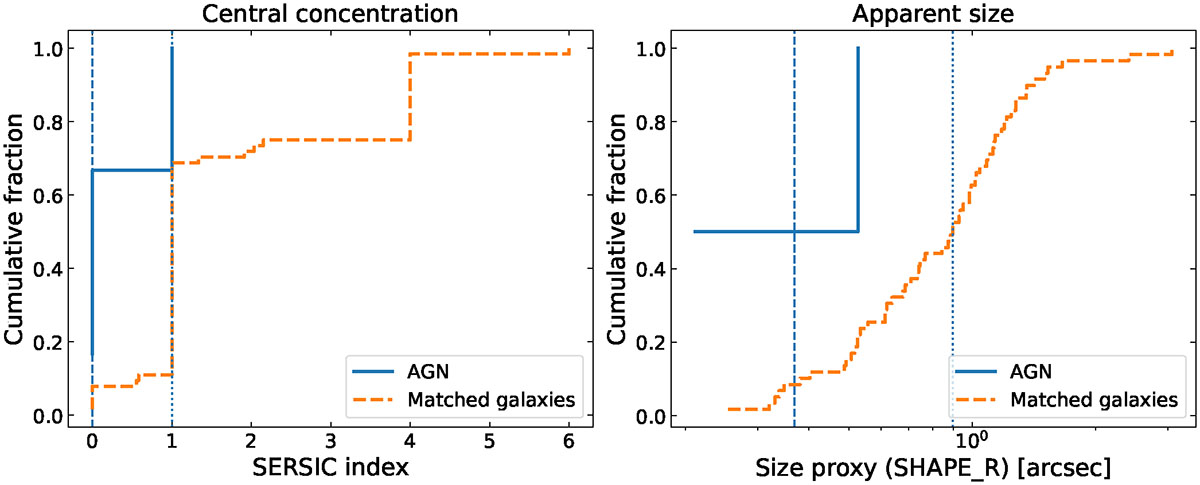
Fig. 4.
Download original image
Cumulative distributions of SERSIC (left) and SHAPE_R (right) for AGNs and matched control galaxies in the 8.5 ≤ log(MBH/M⊙) < 9.0 bin. The vertical lines indicate the sample medians. Owing to the small number of AGNs with reliable DESI morphology, especially for SHAPE_R, this comparison is intended as a qualitative illustration only.
Current usage metrics show cumulative count of Article Views (full-text article views including HTML views, PDF and ePub downloads, according to the available data) and Abstracts Views on Vision4Press platform.
Data correspond to usage on the plateform after 2015. The current usage metrics is available 48-96 hours after online publication and is updated daily on week days.
Initial download of the metrics may take a while.