Fig. 1.
Download original image
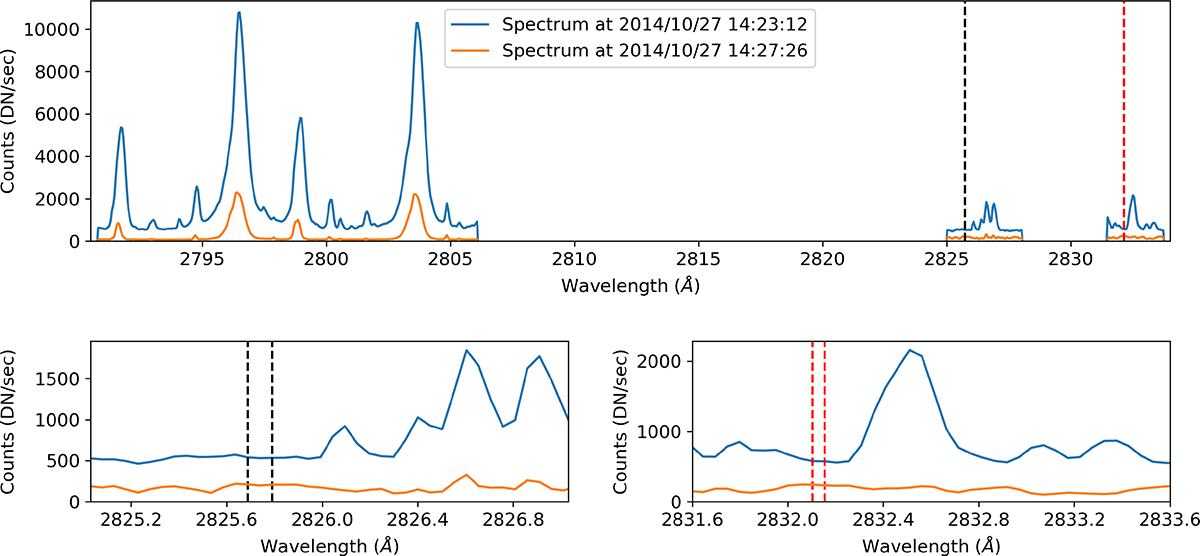
Observed Mg II h and k spectrum, with the continuum windows used in this study (vertical dashed lines). The continuum windows are located far from the wings of the strong resonant Mg II lines at 2796 and 2803 Å. Bottom: Magnified views of the selected continuum regions. The blue spectrum corresponds to the time when the continuum emission was enhanced, while the orange spectrum represents the post-enhancement period during the flare’s impulsive phase.
Current usage metrics show cumulative count of Article Views (full-text article views including HTML views, PDF and ePub downloads, according to the available data) and Abstracts Views on Vision4Press platform.
Data correspond to usage on the plateform after 2015. The current usage metrics is available 48-96 hours after online publication and is updated daily on week days.
Initial download of the metrics may take a while.