Fig. 10.
Download original image
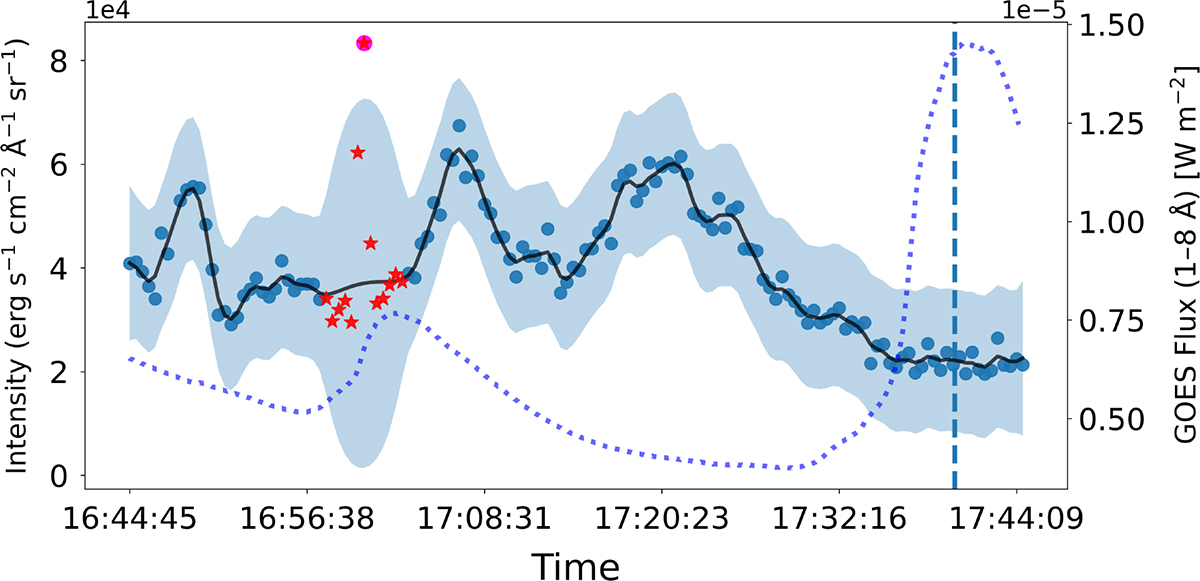
Misattributed NUV continuum enhancement caused by an unrecognized flare (27-10-2014 16:56–17:02), within a time series clipped around a GOES-reported M-class flare (vertical dotted blue line). The red stars represent the 5-minute segment excluded for GPR interpolation; and the magenta circle marks the detected enhancement. The black curve and blue-shaded region represent the GPR mean and 3σ confidence interval. The GOES X-ray flux is shown as the dotted blue curve.
Current usage metrics show cumulative count of Article Views (full-text article views including HTML views, PDF and ePub downloads, according to the available data) and Abstracts Views on Vision4Press platform.
Data correspond to usage on the plateform after 2015. The current usage metrics is available 48-96 hours after online publication and is updated daily on week days.
Initial download of the metrics may take a while.