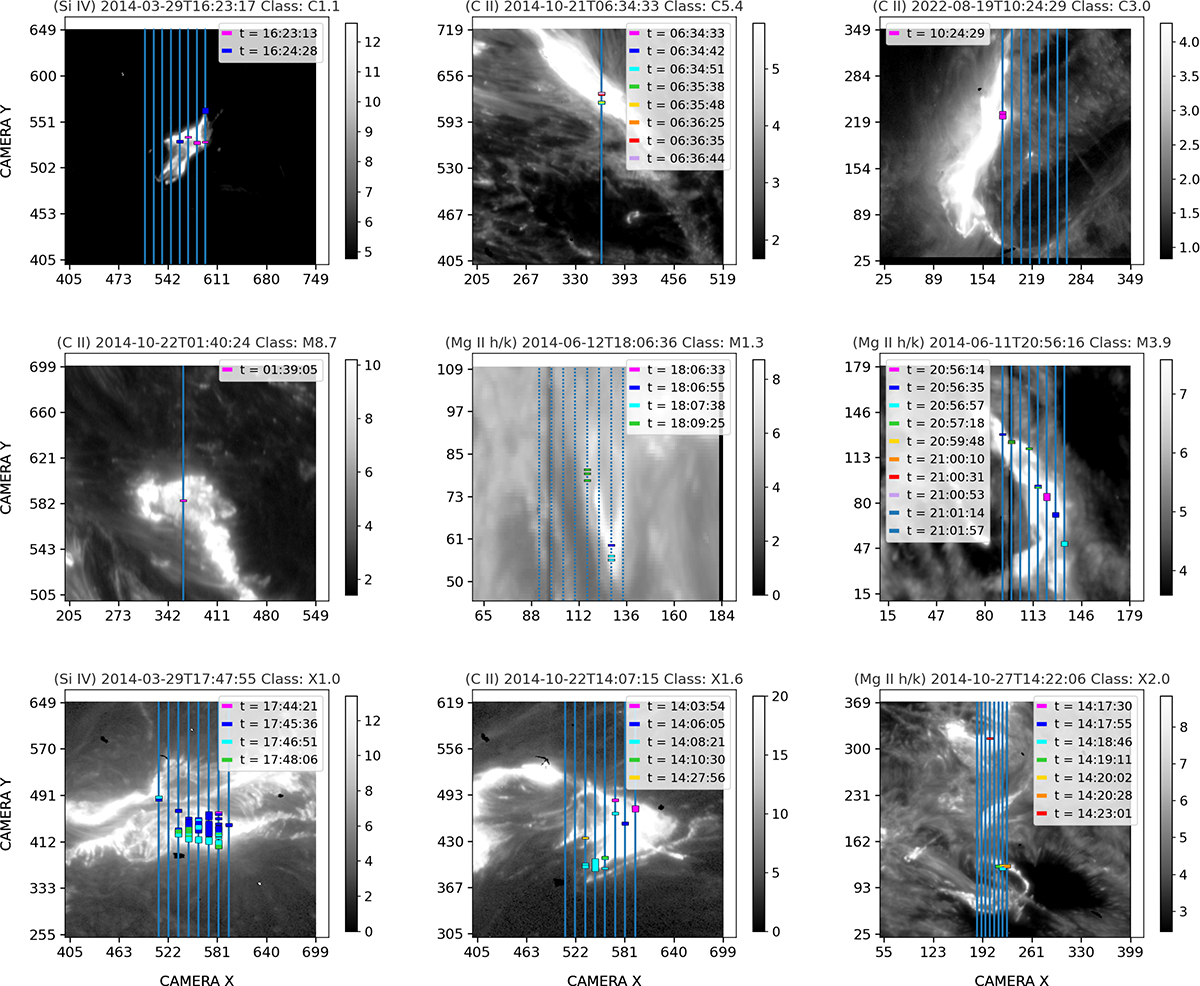
Fig. 11.
Download original image
Spatial and temporal information of NUV continuum enhancements detected using the IF pipeline. The horizontal markers show the spatial locations of significant enhancements, with thresholds set at 3σ for the C-class, 5σ for the M- and X-classes, and 14σ for the X2.0 flare to reduce visual clutter in stronger events. Thus, the area of enhancement is not directly comparable. All enhanced pixels lie on the flare ribbons; any apparent spatial offsets arise from plotting multiple enhancement timestamps onto a single SJI frame. Each color represents a specific raster (i.e., all raster steps from a single raster scan), where each raster step corresponds to a different time.
Current usage metrics show cumulative count of Article Views (full-text article views including HTML views, PDF and ePub downloads, according to the available data) and Abstracts Views on Vision4Press platform.
Data correspond to usage on the plateform after 2015. The current usage metrics is available 48-96 hours after online publication and is updated daily on week days.
Initial download of the metrics may take a while.