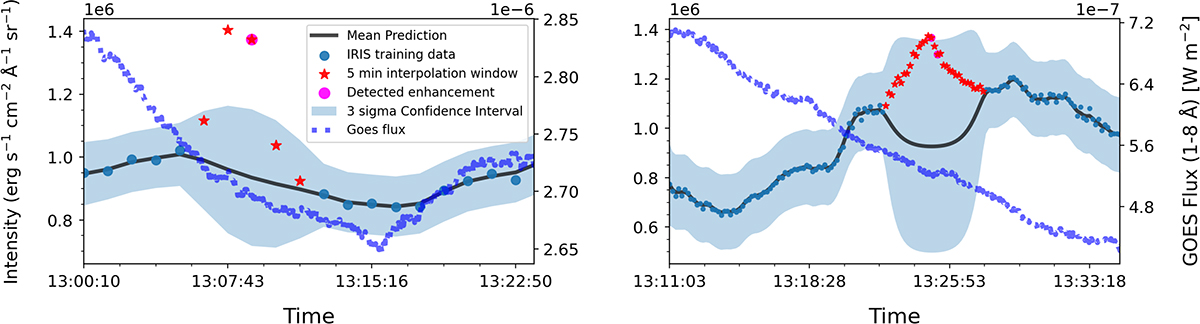
Fig. 13.
Download original image
Example time series wherein the IF pipeline detected ≥3σ NUV continuum enhancement with corresponding FUV continuum enhancement but without any apparent change in GOES soft X-ray flux at the timestamps of enhancement. Left: Observation GOES start time (2014-02-11 C-Class flare, raster position 5, pixel 812) at 13:15:00. Right: Observation GOES start time (2015-09-16 B-Class flare, raster position 0, pixel 98) at 13:38:00. NUV continuum enhancements were detected approximately 7 min and 13 min before the GOES start time.
Current usage metrics show cumulative count of Article Views (full-text article views including HTML views, PDF and ePub downloads, according to the available data) and Abstracts Views on Vision4Press platform.
Data correspond to usage on the plateform after 2015. The current usage metrics is available 48-96 hours after online publication and is updated daily on week days.
Initial download of the metrics may take a while.