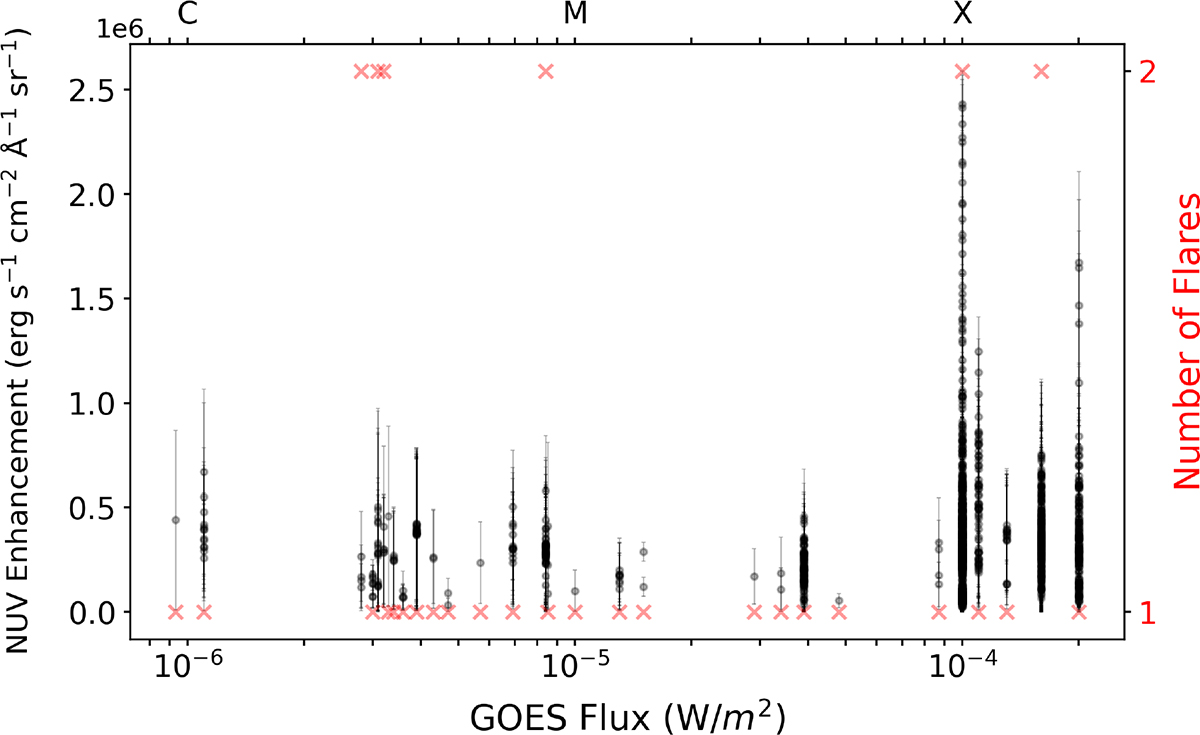
Fig. 14.
Download original image
Magnitude of ≥3σ NUV continuum enhancements as a function of GOES flare flux, detected using the IF detection pipeline. The black points with error bars represent the enhancement magnitudes estimated from individual enhanced pixel time series for a specific flare class. A single time series may contain multiple enhanced timestamps and can therefore contribute multiple enhancement magnitude estimates to the plot. A jittered version of this plot, included in the appendix Fig. A.2, shows the density of detections. The total number of flares contributing to these measurements is shown by the red crosses. Stronger enhancements are predominantly observed for the most energetic (X-class) flares.
Current usage metrics show cumulative count of Article Views (full-text article views including HTML views, PDF and ePub downloads, according to the available data) and Abstracts Views on Vision4Press platform.
Data correspond to usage on the plateform after 2015. The current usage metrics is available 48-96 hours after online publication and is updated daily on week days.
Initial download of the metrics may take a while.