Fig. A.2.
Download original image
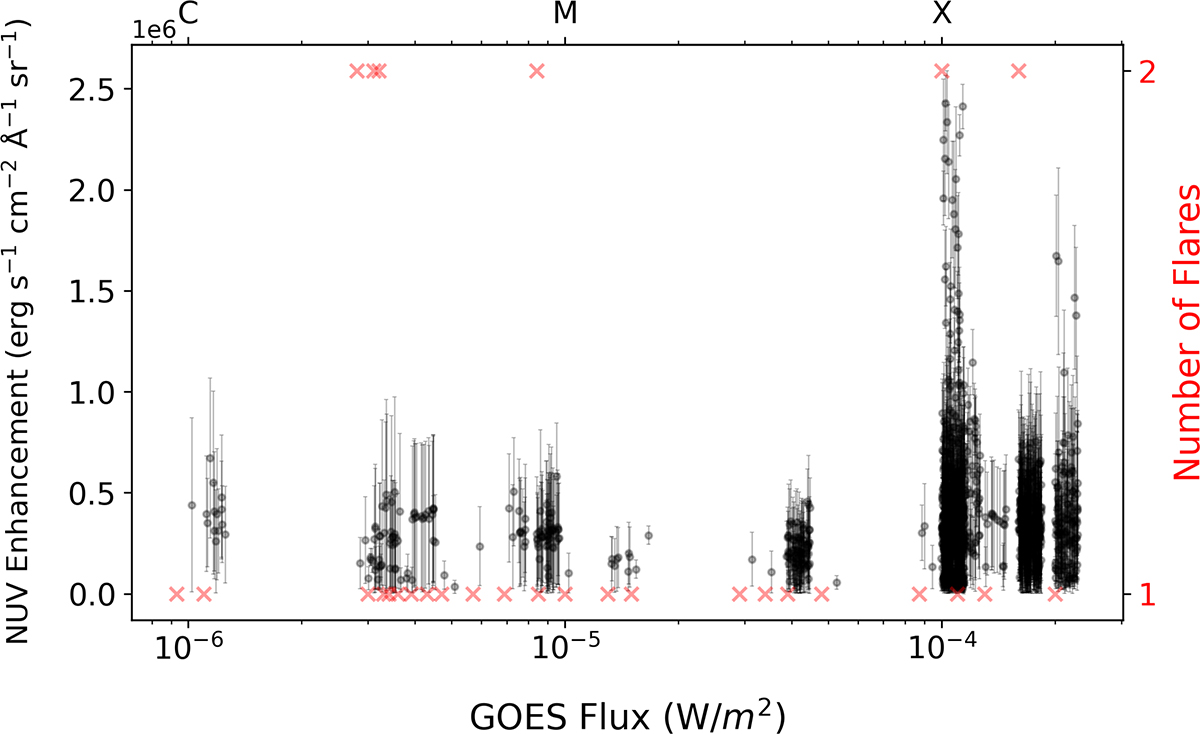
Magnitude of ≥3σ NUV continuum enhancements across different GOES flare flux, detected using the IF pipeline. Small random offsets (jitter) have been applied to the flare flux axis to reduce overlap and improve visualization. The marker definitions are consistent with those used in Fig. 14. The introduction of jitter helps show a clear trend of increasing enhancement magnitude within the M-class flare regime. However, a few detections from X1.0-class flares may overlap with the M9.9-class region due to the jitter, which is why Figure 14 should be consulted in parallel for accurate interpretation.
Current usage metrics show cumulative count of Article Views (full-text article views including HTML views, PDF and ePub downloads, according to the available data) and Abstracts Views on Vision4Press platform.
Data correspond to usage on the plateform after 2015. The current usage metrics is available 48-96 hours after online publication and is updated daily on week days.
Initial download of the metrics may take a while.