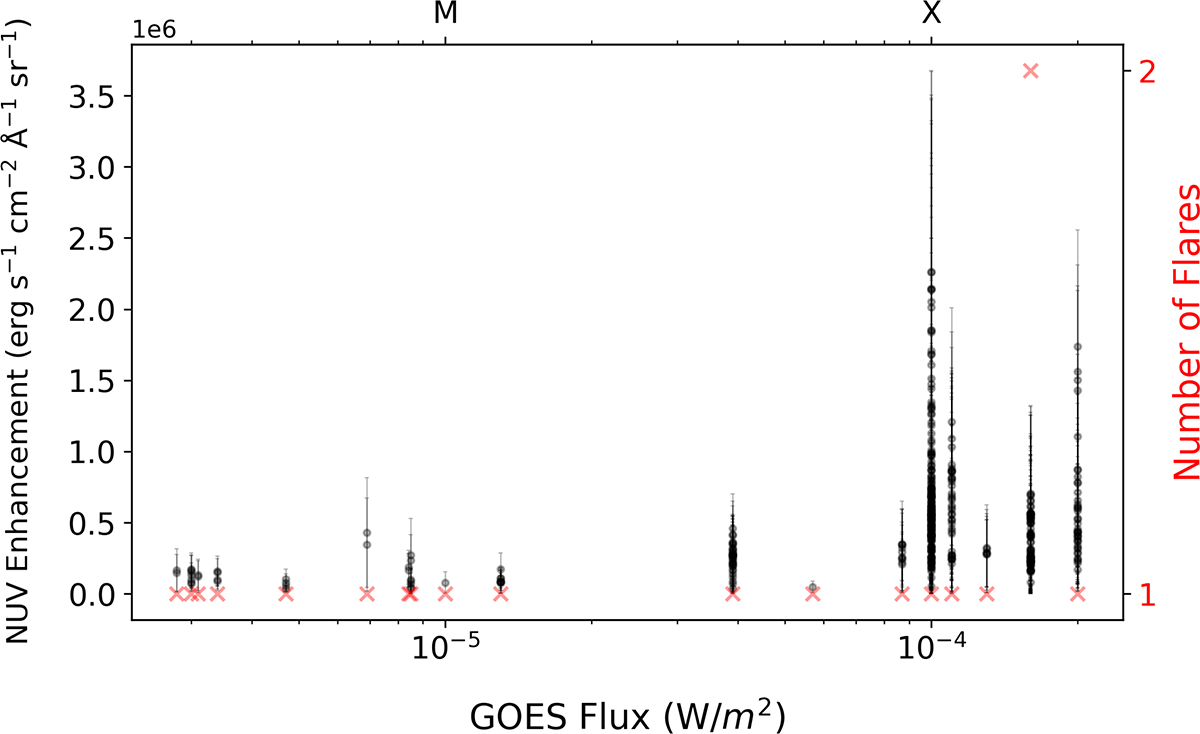
Fig. A.3.
Download original image
Magnitude of ≥3σ NUV continuum enhancements as a function of GOES flare flux, detected using the intensity threshold detection pipeline, plotted without jitter. Marker definitions are consistent with those in Fig. 14. With the exception of one C-class flare showing a wide prediction interval, the enhancement magnitude generally increases with flare class. A few flares show significantly fewer and weaker detections, which is likely due to limited coverage of the flare ribbons by the IRIS slit.
Current usage metrics show cumulative count of Article Views (full-text article views including HTML views, PDF and ePub downloads, according to the available data) and Abstracts Views on Vision4Press platform.
Data correspond to usage on the plateform after 2015. The current usage metrics is available 48-96 hours after online publication and is updated daily on week days.
Initial download of the metrics may take a while.