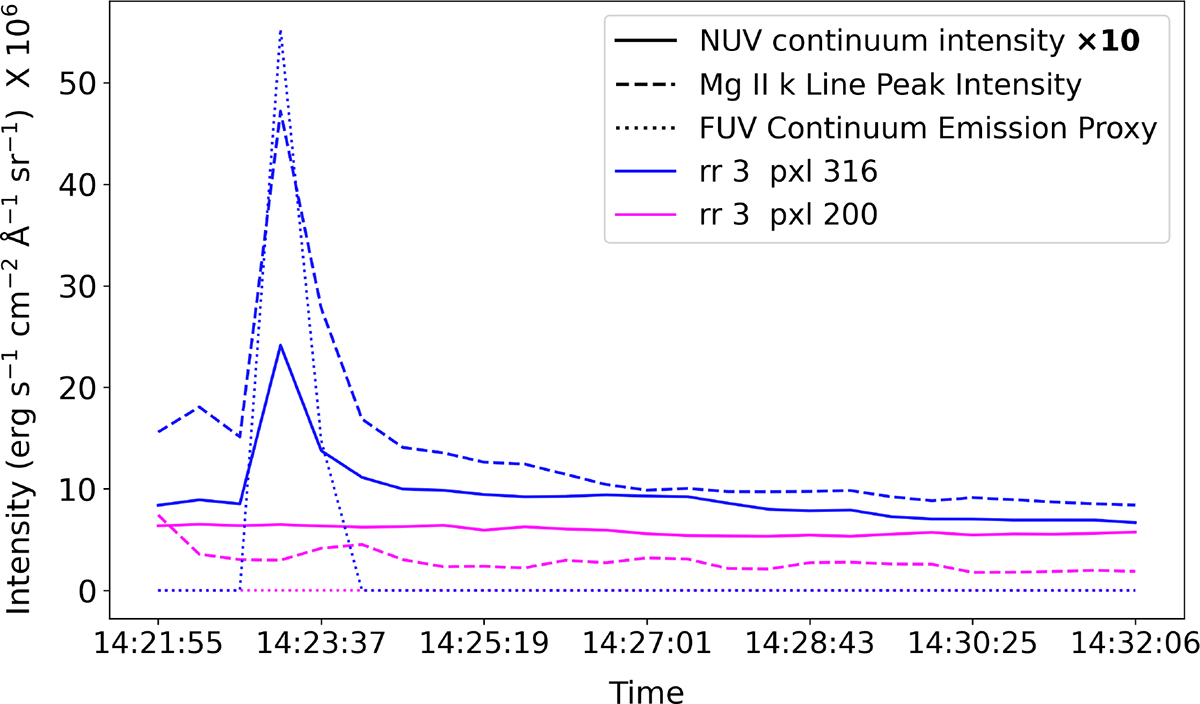
Fig. 2.
Download original image
Impulsive increase observed in the NUV continuum (2826 Å window; solid line), the peak intensity of the Mg II k line (dashed line), and the FUV continuum emission proxy (dotted line) at pixel (pxl) 316 (blue), raster position (rr) 3, during an X-class flare on 27-10-2014 at 14:23:12. In contrast, no such behavior is seen in the time series of other pixels on the same raster position, such as pixel 200 (pink line). Refer to Fig. 3 for the SJI image.
Current usage metrics show cumulative count of Article Views (full-text article views including HTML views, PDF and ePub downloads, according to the available data) and Abstracts Views on Vision4Press platform.
Data correspond to usage on the plateform after 2015. The current usage metrics is available 48-96 hours after online publication and is updated daily on week days.
Initial download of the metrics may take a while.