Fig. 6.
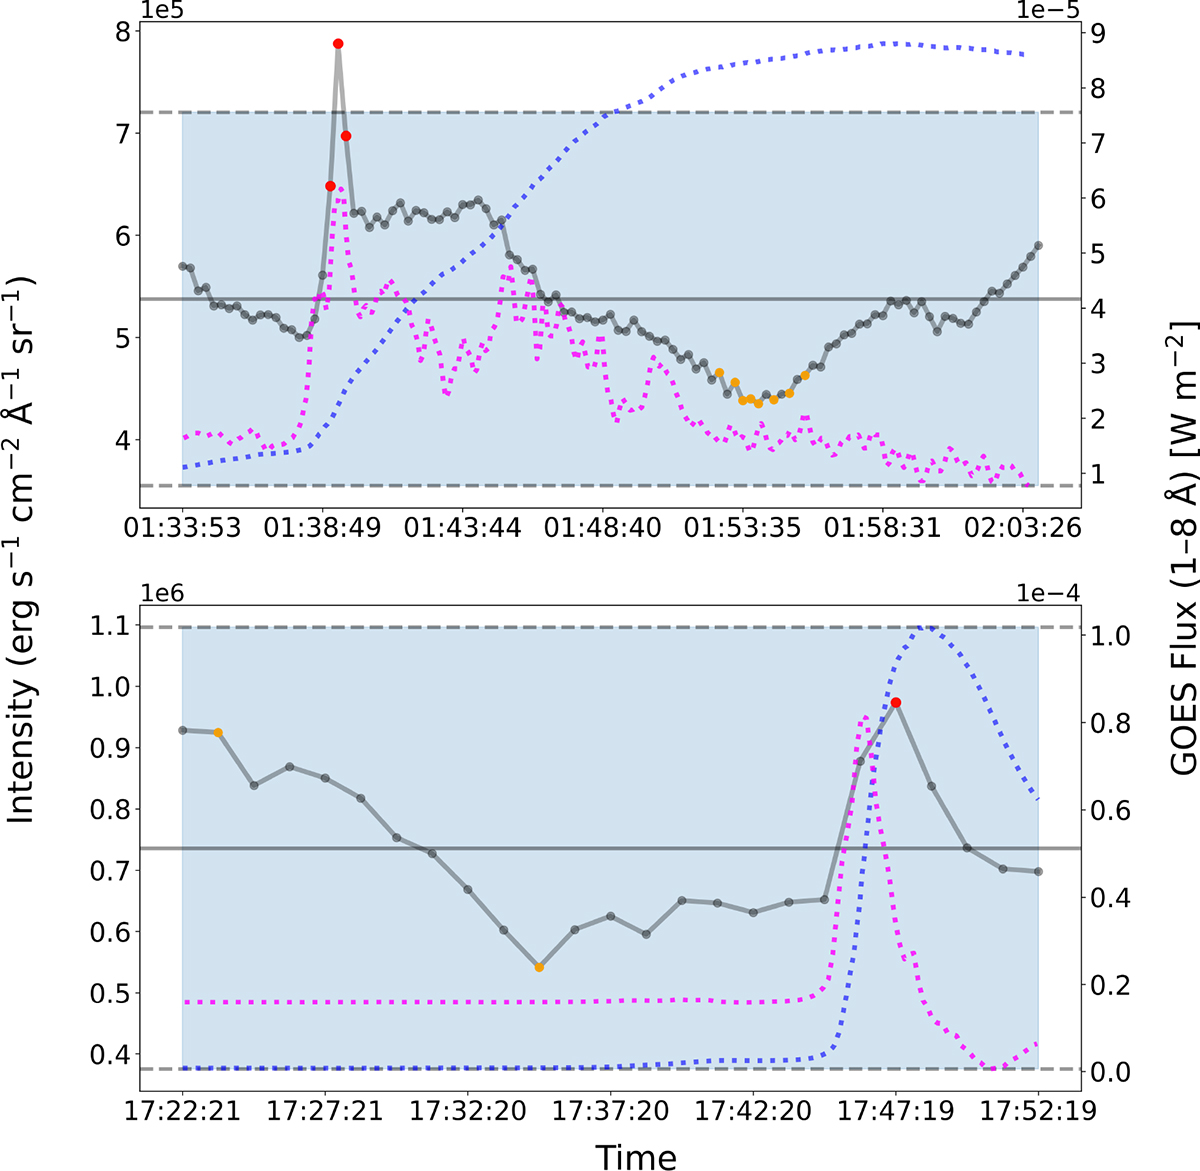
Download original image
Comparison between outlier detections, using the three-sigma threshold (blue-shaded region) around the mean (horizontal solid black line) and IF with a contamination parameter of 0.1. The colored points are outlier candidates detected by IF, and the red points are true positive enhancements filtered by detecting corresponding FUV continuum emission. Top: 2014-10-22 M-class flare with the IF accurately detecting the rising and decay phase of the enhancement. Bottom: 2014-03-29 X-class flare, with the IF detecting enhancements in cases where a simple intensity threshold would fail. The dotted blue curve represents the GOES flux. The dotted magenta curve represents the time derivative of the 3 s averaged GOES flux (arbitrarily scaled), often used as a proxy signature of nonthermal processes.
Current usage metrics show cumulative count of Article Views (full-text article views including HTML views, PDF and ePub downloads, according to the available data) and Abstracts Views on Vision4Press platform.
Data correspond to usage on the plateform after 2015. The current usage metrics is available 48-96 hours after online publication and is updated daily on week days.
Initial download of the metrics may take a while.