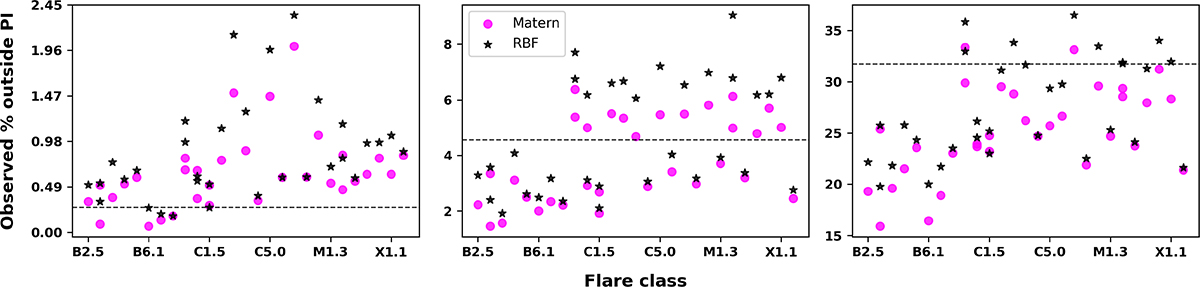
Fig. 8.
Download original image
Percentage of test points outside the predicted 3σ (left), 2σ (middle), and 1σ (right) prediction interval, shown for Gaussian process models using Matérn (magenta) and RBF (black) kernels. The horizontal dotted lines represent the theoretical expected percentage of points that lie outside the “n” sigma prediction interval. The RBF kernel overshoots the percentage of points outside the prediction interval compared to Matérn in most flare classes for the 3σ performance evaluation, rendering the Matérn kernel the better choice for uncertainty estimation.
Current usage metrics show cumulative count of Article Views (full-text article views including HTML views, PDF and ePub downloads, according to the available data) and Abstracts Views on Vision4Press platform.
Data correspond to usage on the plateform after 2015. The current usage metrics is available 48-96 hours after online publication and is updated daily on week days.
Initial download of the metrics may take a while.