Fig. 9.
Download original image
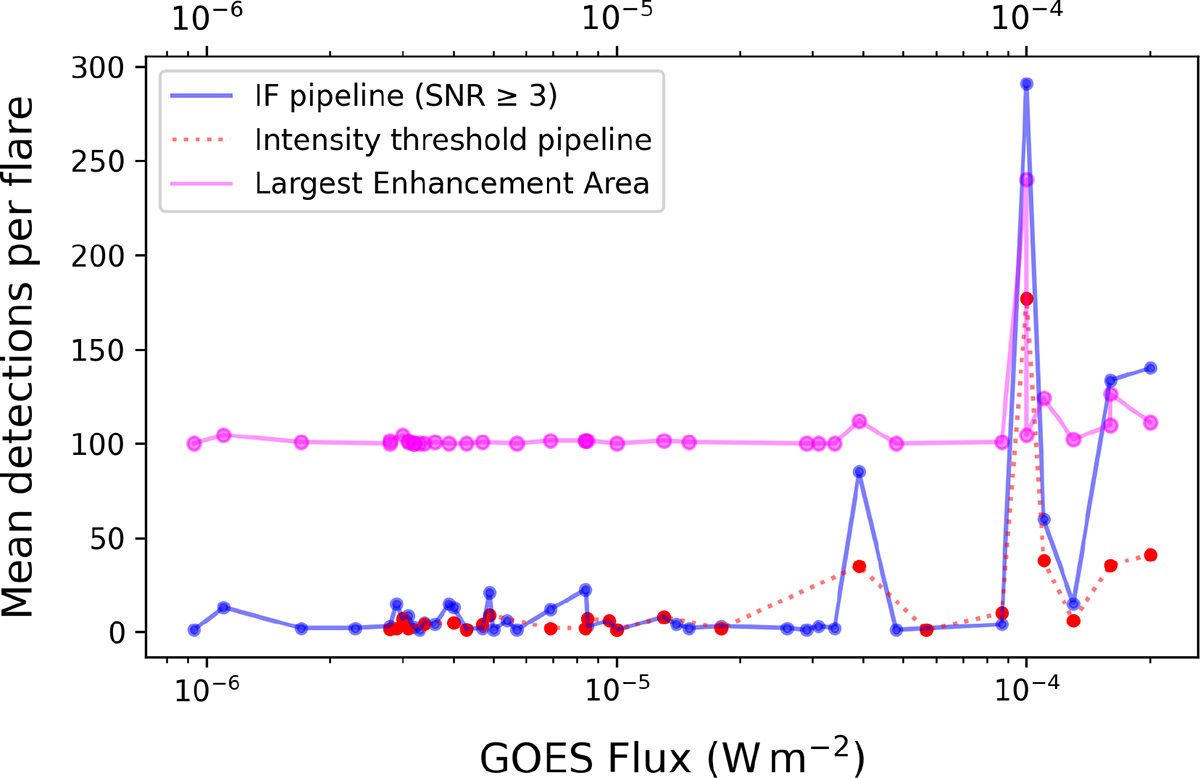
Comparison of detection performances between the IF-based (≥3σ) and intensity threshold-based enhancement detection methods. The y-axis shows the mean number of detected enhancement timestamps per flare, normalized by the number of flares in each GOES flux bin. The GPR-based pipeline consistently identifies more enhancement timestamps across the flare flux range. The magenta curve shows the maximum number of enhanced pixels corresponding to a full raster scan (arbitrary scaling).
Current usage metrics show cumulative count of Article Views (full-text article views including HTML views, PDF and ePub downloads, according to the available data) and Abstracts Views on Vision4Press platform.
Data correspond to usage on the plateform after 2015. The current usage metrics is available 48-96 hours after online publication and is updated daily on week days.
Initial download of the metrics may take a while.