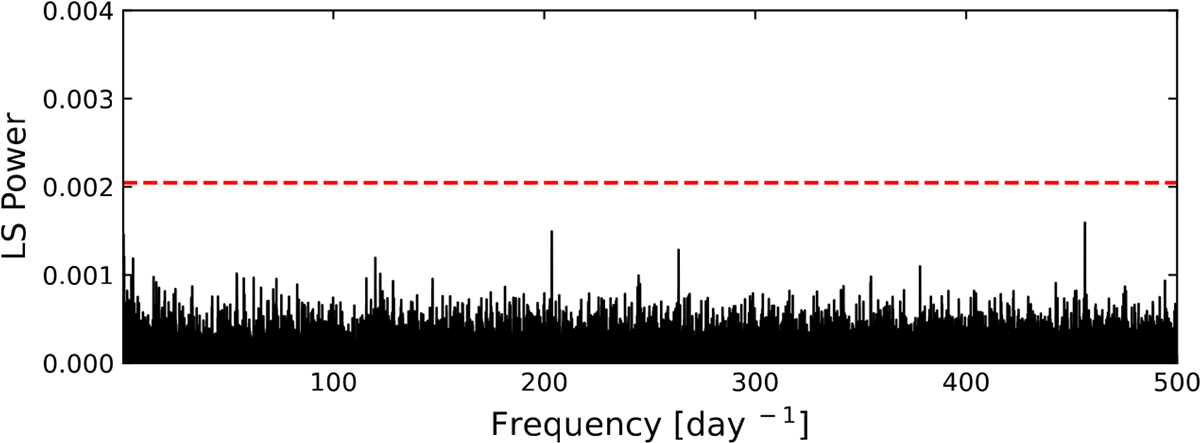
Fig. A.1.
Download original image
Periodogram of HE1518. The red dotted line outlines our FAP threshold corresponding to a S/N of ≈ 5. Aliasing effects caused by gaps in the time series data dominate the low-frequency regime corresponding to periods longer than 3 days, and we therefore truncate the periodogram accordingly. These results show no indication of variability above the significance threshold.
Current usage metrics show cumulative count of Article Views (full-text article views including HTML views, PDF and ePub downloads, according to the available data) and Abstracts Views on Vision4Press platform.
Data correspond to usage on the plateform after 2015. The current usage metrics is available 48-96 hours after online publication and is updated daily on week days.
Initial download of the metrics may take a while.