| Issue |
A&A
Volume 710, June 2026
|
|
|---|---|---|
| Article Number | A99 | |
| Number of page(s) | 13 | |
| Section | Stellar structure and evolution | |
| DOI | https://doi.org/10.1051/0004-6361/202659703 | |
| Published online | 03 June 2026 | |
Stars on the ascending helium giant branch
I. From white dwarf merger to helium giant: the evolutionary state of the rapidly rotating hot subdwarf HE 1518-0948
1
Institut für Physik und Astronomie, Universität Potsdam, Karl-Liebknecht-Str. 24/25, D-14476 Potsdam, Germany
2
Instituto de Astrofísica de La Plata, Consejo Nacional de Investigaciones Científicas y Técnicas Avenida Centenario (Paseo del Bosque) S/N, B1900FWA, La Plata, Argentina
3
Facultad de Ciencias Astronómicas y Geofísicas, Universidad Nacional de La Plata, Avenida Centenario (Paseo del Bosque) S/N, B1900FWA, La Plata, Argentina
4
Hamburger Sternwarte, University of Hamburg, Gojenbergsweg 112, D-21029 Hamburg, Germany
★ Corresponding author: This email address is being protected from spambots. You need JavaScript enabled to view it.
Received:
4
March
2026
Accepted:
10
April
2026
Abstract
Hot subdwarf stars with masses above 0.8 M⊙ ascend the helium giant branch after the end of core helium burning, before entering the white dwarf cooling track or exploding as type Ib/c supernovae. Such massive helium stars are typically expected to form through the stripping of an intermediate-mass star by a binary companion. Even after being stripped, the stars are expected to retain a detectable amount of hydrogen, but there is also the class of extreme helium-rich hot subdwarfs (He-sdOs), which show no traces, or only very weak traces, of hydrogen in their spectra. Several evolutionary channels have been proposed to explain their formation, but their extremely low binary fraction suggests that they are either created through single-star evolution triggered by a late hot flash in a low-mass red giant or the merger of two helium white dwarfs (WDs). Most He-sdOs are located close to the helium zero age main sequence, while a small number exhibit much lower surface gravities, indicating inflated radii. Whether these objects are evolutionarily connected to the main He-sdO population remains unclear. For this work we analysed the extreme helium-rich, low-surface-gravity sdO HE 1518–0948 (HE 1518) through a detailed spectroscopic study of optical and ultraviolet data. We measured an effective temperature of 52 000 ± 2500 K, a surface gravity log g of 4.64 ± 0.15 dex, an upper limit for the hydrogen abundance of log(nHe/nH) < 2.5, and an exceptionally high projected rotational velocity of 90 ± 20 km s−1, significantly higher than that of most known He-sdOs. The star is found to belong kinematically to the Galactic halo, consistent with the very low metallicity derived from our abundance analysis. A comparison with evolutionary models indicates that HE 1518 is the product of a massive double helium white dwarf merger and is currently undergoing helium shell burning while ascending the helium giant branch. This makes HE 1518 one of only a few known objects located in this sparsely populated region of the Hertzsprung–Russell diagram. Such stars provide valuable laboratories for studying the evolution of massive hot subdwarfs beyond core helium burning, and their high luminosities allow them to be detected at large distances.
Key words: stars: abundances / stars: evolution / stars: horizontal-branch / subdwarfs
© The Authors 2026
 Open Access article, published by EDP Sciences, under the terms of the Creative Commons Attribution License (https://creativecommons.org/licenses/by/4.0), which permits unrestricted use, distribution, and reproduction in any medium, provided the original work is properly cited.
This article is published in open access under the Subscribe to Open model. This email address is being protected from spambots. You need JavaScript enabled to view it. to support open access publication.
1. Introduction
Hot subdwarf O (sdO) and B (sdB) stars are evolved core or shell helium-burning stars that have lost most of their hydrogen-rich envelope (for reviews, see Heber 2016, 2026). The subclass of helium-rich sdOs (He-sdO) show only very weak or even no hydrogen traces in their spectra. Radial velocity (RV) surveys of hydrogen-rich sdBs reported binary fractions between 30 and 70% (Maxted et al. 2001; Copperwheat et al. 2011; Kawka et al. 2015; Geier et al. 2022; He et al. 2025), and Pelisoli et al. (2020) provide observational evidence that binary interactions are likely always required for their formation. The main proposed formation channels are a stable Roche-lobe overflow or a common envelope phase of low-mass stars (≲1.8 M⊙) at the tip of the red giant branch evolution. In the case of intermediate-mass stars (1.8 M⊙ < M ≲ 10 M⊙), it might already happen after the end of core hydrogen burning (Han et al. 2002, 2003; Götberg et al. 2018).
In contrast, observational studies indicate that helium-rich sdOs are rarely found in binaries. Snowdon et al. (2025) performed a binarity search among the extreme and intermediate helium-rich hot subdwarfs observed in the SALT survey of hydrogen-deficient stars (Jeffery et al. 2023, 2026). The authors found that all extreme helium-rich objects in their sample were single, which is in clear contrast to the hydrogen-rich objects (see also Geier et al. 2022; He et al. 2025). Thus, there is strong evidence that the helium-rich hot subdwarfs originate from evolutionary channels different than the envelope stripping scenarios proposed for hydrogen-rich sdBs.
Most He-sdOs have effective temperatures (Teff) between 40 and 55 kK and surface gravity (log g) values between 5.5 and 6.0 dex (e.g. Stroeer et al. 2007; Németh et al. 2012; Luo et al. 2021; Latour et al. 2026). They are divided into intermediate helium-rich objects (iHe-sdOBs), characterised by atmospheric helium abundances in the range −1.2 < log(nHe/nH) < 0.6, and extreme helium-rich hot subdwarfs (eHe-sdOs), which have log(nHe/nH) > 0.6 (Latour et al. 2026; Dawson et al. 2026; Heber et al. 2026). The eHe-sdOs can be further divided into three subclasses depending on the amount of nitrogen and carbon visible in their spectra, as either C-rich, C- and N-rich, or N-rich but C- and O-poor (Stroeer et al. 2007; Hirsch 2009).
These abundance patterns are typically explained by the merger of two helium white dwarfs (WD; Webbink 1984; Zhang & Jeffery 2012). The C-rich stars are created through a (hot) fast merger where some of the helium ignites and burns into carbon, which enriches the atmosphere (C-type). In this process, nitrogen is destroyed through α-capture and transformed into oxygen and neon. However, carbon enhancement could also result from a late hot flash (Miller Bertolami et al. 2008; Battich et al. 2018). In this scenario (Lanz et al. 2004), a red giant experiences the helium flash after losing most of its envelope. Recent simulations from Battich et al. (2025) show that this event can produce the conditions required for i-process nucleosynthesis. This mechanism could explain the extreme overabundance of heavy metals observed in several intermediate helium-rich hot subdwarfs (Dorsch et al. 2020, 2021).
In the case of a slow He-WD+He-WD merger, no burning occurs, leaving surface material enriched in nitrogen as created by the CNO burning in the progenitor stars, observed as an N-type He-sdO. Another proposed channel to form He-sdOs of the N-type is the stripping of a H-rich sdO/B by a close compact companion (Rajamuthukumar et al. 2025). Progenitor binaries, some of them with accretion disks, have been found (e.g. Kupfer et al. 2020a,b; Stringer et al. 2023) as well as the N-type He-sdO US 708, which is thought to be the stripped donor ejected by a supernova type Ia (Geier et al. 2015). However, the low binary fraction of eHe-sdOs implies that this cannot be the dominant formation channel for this subtype.
Helium-rich hot subdwarfs enriched in carbon and nitrogen (CN-type) are predicted to form when part of the material is accreted rapidly during a WD merger, while the remainder is accreted more slowly from a surrounding disk, thus increasing the nitrogen abundance (Zhang & Jeffery 2012). The late hot flasher scenario might also result in CN-type He-sdOs (Miller Bertolami et al. 2008; Battich et al. 2018). Stars with a similar surface composition, but very different internal structure, can also be created during a merger of a carbon-oxygen (C/O) WD and a He-WD (Jeffery et al. 2011). The remnant initially evolves into a helium giant, observed as an R Coronae Borealis (R CrB) star, and subsequently appears as a very luminous, helium giant classified as an extreme helium (EHe) star (Jeffery 2008) and later O(He) star (Reindl et al. 2014), before descending onto the white dwarf cooling track.
A few He-sdOs have surface gravities below 5.0 dex and are therefore located far above the helium zero age main sequence (He-ZAMS). These objects may follow an evolutionary pathway different from that of the bulk of the He-sdO population, potentially representing a distinct subgroup.
Here, we present a detailed analysis of the low-gravity hot subdwarf HE 1518−0948 (hereafter HE 1518) that was first classified by Moehler et al. (1990) as He-sdO. Stroeer et al. (2007) reported an unusually low surface gravity, but were unable to model the spectrum sufficiently because it was outside their grid boundaries. In this paper, we present a detailed analysis of the star by combining available spectroscopic, photometric, and astrometric data to derive its atmospheric parameters and elemental abundances (Sects. 3–7). Based on these results and a comparison with evolutionary tracks, we discuss its evolutionary history and future, as well as its enrichment with nuclear-processed material compared to previously analysed He-sdOs (Sect. 8).
2. Observations
Spectroscopic observations of HE 1518 span more than 20 years and cover wavelengths from the ultraviolet (UV) to the infrared. The spectroscopic analysis presented here is based on two high-resolution optical spectra obtained with the Ultraviolet and Visual Echelle Spectrograph (UVES) mounted on the Very Large Telescope (VLT), as well as UV spectra acquired with the Space Telescope Imaging Spectrograph (STIS) on board the Hubble Space Telescope (HST).
The UVES spectra were obtained in the course of the ESO Supernova Ia Progenitor SurveY (SPY; Napiwotzki et al. 2020). They have a resolving power of R ≃ 20 000 and cover a wide wavelength range from 3300 to 6650 Å, with gaps at 4500–4600 Å and 5600–5700 Å. For the spectroscopic analysis both spectra were co-added resulting in an average signal-to-noise ratio (S/N) of 36.
The STIS spectra have a resolving power of R = 45 800, making them the highest-resolution data available for this star. They cover the wavelength range 1144–1729 Å. HE 1518 was observed during three consecutive HST orbits, and the resulting spectra were co-added to improve the S/N. Owing to the high projected rotational velocity of the star (see Section 3), the spectrum was further rebinned to a resolving power of R = 20 000 without significant loss of information, yielding an average S/N of about 72.
The remaining 30 spectra were taken mostly in the course of the Massive Unseen Companions to Hot Faint Underluminous Stars from SDSS (MUCHFUSS) programme (Geier et al. 2011; Kupfer et al. 2015) using the Intermediate Dispersion Spectrograph (IDS) at the Isaac Newton Telescope (INT), the Intermediate-dispersion Spectrograph and Imaging System (ISIS) at the William Herschel Telescope (WHT), and the Goodman spectrograph at the Southern Astrophysical Research Telescope (SOAR). The spectra obtained with these instruments were used only to measure their radial velocities because of their lower resolving power compared to the UVES and STIS data. An overview of all spectra is given in Table A.1.
3. Spectral analysis and spectroscopic parameters
To determine Teff, log g, projected rotational velocity (vrot sin i), radial velocity (vrad), and elemental abundances, we fitted the UVES and STIS spectra. They were chosen for their high resolution and extensive coverage, spanning the UV to infrared range.
As an initial estimate of the atmospheric parameters, we fitted the UVES spectrum using a grid of non-local thermodynamic equilibrium (NLTE) model atmospheres computed with TLUSTY/SYNSPEC (Hubeny & Lanz 2017). The grid spans effective temperatures of 26 250 to 57 500 K, surface gravities of 4.25 ≤ log g ≤ 6.5, and helium abundances of −1.75 ≤ log(nHe/nH)≤ 4.00. The models include full line blanketing1 and assume plane-parallel, homogeneous, hydrostatic atmospheres; further details are given in Dorsch (2024). Spectral fitting was performed with the Interactive Spectral Interpretation System (ISIS; Houck & Denicola 2000), which applies a χ2 minimisation to hydrogen and helium line profiles following the method of Irrgang et al. (2014) to determine the best-fitting parameters.
An initial modelling attempt by Stroeer et al. (2007) placed the star outside the boundaries of their grid. They suggest an effective temperature of around 60 000 K and a surface gravity log g below 4.8 dex. Our analysis yields a temperature of 52 000 ± 2500 K, a surface gravity of 4.64 ± 0.15 dex, and a projected rotational velocity vrot sin i of 90 ± 20 km s−1.
Although our models include line blanketing and non-LTE effects, they underpredict the strengths of the He II lines, as can be seen in Fig. 1. This persistent discrepancy, known as the Balmer/He II line problem, reflects remaining limitations in the modelling of hot stellar atmospheres and has been noted in analyses of hot subdwarfs (Lanz et al. 1997; Latour et al. 2015) and white dwarfs (Werner et al. 2018), particularly at high Teff. Therefore, the effective temperature is primarily constrained by the He I lines and the UV C III/IV features (see Sect. 4). In our models, this issue becomes apparent at temperatures of about 46 000 K. To compensate for this effect, χ2 fitting tends to favour models with higher hydrogen abundances, as the overlap between the He II Pickering and H Balmer series partially fills in the affected lines. To avoid this bias, we set log(nHe/nH) = 3.5 ± 0.5 and enforce the H-poor solution, although small quantities of hydrogen may lie below log(nHe/nH) < 2.5, which we determine as our detection threshold. Above this limit, the hydrogen emission in the Hα line becomes visible.
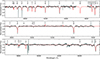 |
Fig. 1. Spectral fit of the optical UVES spectrum (black). The model is overplotted (red). |
4. Abundances
The values determined in Sect. 3 served as the initial parameters for constructing a refined TLUSTY/SYNSPEC model, which was then applied to the STIS and UVES spectra. The parameters Teff, log g, and log(nHe/nH) were kept fixed. The elements C, N, O, Ne, Mg, Si, P, S, Fe, and Ni are treated in NLTE whereas Al, Ar, Ti, Cr, Mn, Co, Zn, Ge, Sr, Zr, and Pb are in LTE. The abundances of these elements were initially determined by visual inspection of the STIS spectrum. For elements lacking visible absorption features, an upper limit for their abundance was estimated by gradually increasing the abundance until lines became detectable. Using these abundances, we created a new grid with SYNSPEC, fixing the effective temperature and surface gravity, while varying the abundances of elements heavier than helium by ±0.9 dex in steps of 0.3 dex. A second fitting procedure was performed using ISIS, and the resulting element abundances were used to calculate a final TLUSTY model. Because of the different opacities between the initial and final models, we examined the UV C III/IV lines to assess whether an update of Teff was required. No adjustment was found to be necessary. The final model is shown in the optical range in Fig. 1.
The optical spectrum is dominated by He II and C III/IV features. A prominent characteristic is the C III emission line near 4650 Å, bracketed by two C IV absorption lines (Fig. 1). A similar configuration has been reported in the SALT survey of hydrogen-deficient stars (Jeffery et al. 2021), particularly among high-Teff, low-log g He-sdO stars such as HE1518. Although our non-LTE models predict emission in the C III 4650 and 5772 Å lines, the overall fit to optical metal lines remains poor. Similar difficulties with optical carbon lines have been shown previously (e.g. Luo et al. 2024) and appear to be associated with the large population fraction of the high-lying energy levels involved in these transitions, which are hard to model. In contrast, the low-lying UV carbon lines are not affected and are well reproduced, except for wind features in C IV 1548, 1551 Å.
The STIS spectrum shows additional lines of N, O, Si, S, and Fe in comparison to the optical spectrum allowing us to determine the metallicity of the star. In contrast to the optical spectrum, the carbon lines in the UV are well reproduced (Fig. 2), highlighting the importance of UV spectroscopy for reliable abundance determinations in such hot stars.
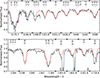 |
Fig. 2. Selected UV lines of carbon, nitrogen, oxygen, silicon, sulphur, and iron. The black line is the observation, red shows the model, and light blue further includes interstellar lines. |
The star also has a noticeable stellar wind that creates the asymmetric shape of the N V, O V, and C IV lines shown in Fig. 3. From this plot, we can also see that HE 1518 is ionising its surrounding interstellar medium (ISM), creating the sharp absorption components in the C IV lines.
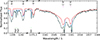 |
Fig. 3. UV lines of C, N, and O affected by the stellar wind of HE 1518. The meaning of the colours is the same as in Fig. 2. |
With an iron abundance roughly 40 times lower than the solar abundance, the star is very metal poor. Because of the large rotational velocity, the iron lines are shallow but remain clearly detectable. We also examined Ne, Mg, P, Al, Ar, Ti, Cr, Mn, Co, Ni, Zn, Ge, Sr, Zr, and Pb in detail by conducting a visual inspection of their strongest features, as listed in Table A.2. For each of these elements, a second model was calculated with the abundance set to zero. By comparing these two models, as exemplified for lead in Fig. 4, we determined whether the element was detected or if only an upper limit could be established. No unambiguous detection was obtained for these elements. The abundances and upper limits are given in Table 1. Solar abundances were taken from Asplund et al. (2009).
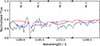 |
Fig. 4. Abundance comparison for lead. The blue model includes all abundances as measured from the χ2 fitting, while the red line is the model without lead. Because there is no unambiguous line identification, we consider this only as an upper limit. This technique was also used for all other elements for which we provide upper limits. |
Abundances of HE 1518–0948 expressed in logarithmic units.
The uncertainties of C, N, O, Si, S, and Fe were derived by iteratively increasing and decreasing the abundances until the model no longer provided an acceptable fit to the observations.
5. Spectral energy distribution
By calculating the spectral energy distribution (SED), mass, radius, and luminosity can be obtained if the star has an accurate distance determination. However, in Gaia Data Release 3 (Gaia Collboration 2023), the parallax of the star is 0.14 mas with an error of 0.04 mas. When applying the zero-point offset following Lindegren et al. (2021) and inflating the uncertainty using the method described in El-Badry et al. (2021), we obtained 0.17 ± 0.05 mas. Due to the large error, we did not consider the parallax to be reliable. Instead, we estimated a mass of 0.9 M⊙ with an uncertainty of 0.1 M⊙ by using evolutionary models and theoretical considerations (see Sect. 8.1 for details).
To model the SED, we fixed Teff, log g, log(nHe/nH), and our mass estimate, while the free-fitting parameters were the angular diameter θ and the colour excess E(44 − 55). Interstellar reddening was accounted for as described in Fitzpatrick et al. (2019). The best-fit solution was obtained by minimising χ2 using the same model grid as in the spectroscopic analysis. Further details about the fitting procedure can be found in Heber et al. (2018).
The results of the spectral and SED analysis, including their 1σ uncertainties, are presented in Table 2 and the SED fit is shown in Fig. A.2. There is no visible infrared excess, allowing us to rule out a luminous cool companion star such as a red giant or subgiant, while a main sequence star would be outshone by the primary. The spectroscopic distance from our analysis is consistent with the parallax distance at the 1σ level.
Atmospheric and stellar parameters of HE 1518-0948.
6. Radial velocity and light curve
The SED analysis presented above rules out the presence of a luminous companion. However, a faint companion that does not contribute significantly to the SED cannot be excluded. To investigate whether HE 1518 hosts a close companion, we therefore examined the 120 s cadence light curve obtained by the Transiting Exoplanet Survey Satellite (TESS) in sectors 51 and 91, and analysed low-resolution spectroscopic observations. The additional low-resolution spectra were taken with instruments that have resolutions Δλ between 3.1 to 0.46 Å. The RV measurements are provided in Table A.1. The majority of the observations were acquired in short groups spanning from a few hours to several days.
The extracted TESS light curves have CROWDSAP values of 0.85 and 0.75, indicating mild crowding, but with most of the flux originating from HE 1518. We combined both sectors, and computed the Lomb–Scargle periodogram shown in Fig. A.1 with a false alarm probability (FAP) threshold of 0.1% (S/N ≈ 5) to assess the significance of any detected peaks (Baran & Koen 2021). Neither in the TESS light curve nor in our RV measurements do we see indications of the existence of a close binary companion. Therefore, we adopted a constant radial velocity of 108 ± 3 km s−1, which is the average from the high-resolution UVES and STIS spectra.
7. Kinematic analysis
We performed a kinematic analysis of HE 1518 to determine its Galactic orbit. For the Galactic potential, we adopted Model I from Irrgang et al. (2013), which is a revised version of the Allen & Santillan (1991) potential. The estimate of our radial velocity and spectroscopic distance (see Sect. 5) together with right ascension, declination, and proper motion from Gaia DR3 (Gaia Collboration 2023) were used to reconstruct the Galactic orbit by integrating it for 15 Gyr. The star is on a highly eccentric orbit with an Lz component close to zero.
Figure 5 shows the position of the star in the Toomre diagram in red, together with the contours of the thin (blue) and thick (green) disk and the halo (grey). We also include the location that we obtained by using the parallax distance shown in orange. In both cases, the kinematic analysis indicates that HE 1518 follows a halo orbit.
 |
Fig. 5. Toomre diagram with HE 1518-0948 marked in red using the spectroscopic distance. In gold, we show its position when using the parallax distance. The blue, green, and grey dotted areas represent the thin disk, thick disk, and halo contours. As a comparison we show the positions of the known He-sdOs from Dorsch (2024), based on the Culpan et al. (2022) sample. The colour-coding is the same as for the contours and represents their Galactic population membership. The position of the Sun is shown as a pink circle. |
8. Discussion
8.1. Mass estimate and previous evolution
Due to the uncertain parallax measurement of HE 1518, an accurate mass cannot be determined from the SED fit. Therefore, we compared the position of the star in the Teff–log g diagram to different theoretical tracks that cross the region where the star is located. In Fig. 6 (left), we show evolutionary tracks for a double He-WD merger with 0.45 M⊙ components (Yu et al. 2021); a 1.9 M⊙ stripped helium star from an initially 7 M⊙ progenitor (Götberg et al. 2018); a 0.8 M⊙ post-asymptotic giant branch (pAGB) model that experienced a very late thermal pulse (VLTP; Miller Bertolami & Althaus 2006); and C/O-WD + He-WD mergers with post-merger masses of 0.7 to 0.9 M⊙ (Saio & Jeffery 2002). From these tracks, we can immediately rule out the C/O-WD + He-WD merger because the surface gravity of these tracks is much lower than that of our observations.
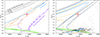 |
Fig. 6. Left: Kiel diagram of HE 1518 illustrating several evolutionary tracks that intersect this region of the diagram. The black solid lines show post-merger evolutionary tracks of C/O+He white dwarf mergers with total masses of 0.7, 0.8, and 0.9 M⊙ from Saio & Jeffery (2002). The orange dashed line represents the evolution of an initially 7.4 M⊙ star stripped by a companion from Götberg et al. (2018), resulting in a helium star with a mass of approximately 1.9 M⊙. The blue line shows the evolution of a star that experienced a very late thermal pulse (VLTP) and is contracting towards higher effective temperatures to enter the white dwarf cooling track from Miller Bertolami & Althaus (2006). The model shown has a mass of 0.51 M⊙. The violet line corresponds to the evolution of a double helium white dwarf merger from Yu et al. (2021), in which both components have masses of 0.45 M⊙. The light green region indicates the location of the He-ZAMS from Paczyński (1971) for helium stars with masses between 0.6 and ∼2.0 M⊙ The arrows indicate the direction of evolution for the corresponding tracks. Right: Stellar evolution for helium stars with 0.7 (gold), 0.8 (blue), and 0.9 M⊙ (black) for two different metallicities Z = 0.001 (solid line) and Z = 0.02 (dashed line; for more details see Sect. 8.1). The grey dots are the observed helium-rich hot subdwarfs in the SALT survey of hydrogen-deficient stars (Jeffery et al. 2026, preliminary results). |
There are scenarios in which stripped stars from intermediate to massive star progenitors can be ejected out of the Galactic thin disk (Renzo et al. 2019). In these models, the more massive primary becomes a helium star by transferring mass onto its companion. Due to the accreted mass, the secondary star evolves faster and undergoes a core-collapse supernova during the lifetime of the hot subdwarf. These models predict ejection velocities of up to 120 km s−1 for helium stars. However, this is much less than the disk-crossing velocity of  that we measured for HE 1518. Furthermore, the short-lived progenitors are young stars that are unlikely to have the low metallicity we obtained for HE 1518. The stripping would also expose material processed by CNO-cycle fusion, meaning that strong nitrogen rather than carbon lines should be visible. Thus, we reject this scenario.
The only tracks left are those for a VLTP and a double helium WD merger. The VLTP evolutionary track from Miller Bertolami (2016) has a helium star mass of 0.5 M⊙. In this scenario, a delayed shell flash occurs when the star has already entered the white dwarf stage. During this event, a large fraction of the remaining helium shell is burned into carbon, producing PG1159 stars. With carbon mass fractions of more than 30% (Jahn et al. 2007; Werner et al. 2016), these stars are significantly more carbon-rich than HE 1518, for which we measure a carbon mass fraction of about 3%. Other post-AGB scenarios create objects that still have large fractions of hydrogen, so we do not consider any of them (Reindl et al. 2016, 2017; Löbling et al. 2019).
An alternative formation channel was proposed by Justham et al. (2011) in which an sdB star merges with a helium white dwarf companion before becoming fully degenerate, avoiding helium flashes. However, all known compact sdB+WD binaries that could merge during the sdB evolution are located inside the Galactic disk (e.g. Kupfer et al. 2017, 2020b, 2022) and likely originate from young, intermediate-mass progenitors. This is inconsistent with HE 1518 being an old halo star.
Thus, only the double helium white dwarf merger scenario remains viable. For this we must assume that both helium white dwarfs were close to their maximum possible masses prior to merging, as can be seen in Fig. 6 (left), in which we include a 0.45 + 0.45 M⊙ He-WD merger track from Yu et al. (2021). However, this track terminates before reaching the observed position of the star.
To study the He-WD merger channel in more detail, we constructed post-merger models starting as He-stars on the He-ZAMS using LPCODE (see Miller Bertolami et al. 2022, and references therein). Convective boundary mixing (overshooting) during the core helium burning phase is defined as in Miller Bertolami (2016). The models include a carbon mass fraction of 3%, which is expected from the initial helium-burning flashes that lift electron degeneracy during the merger process. Two sets of tracks with masses of 0.5, 0.6, 0.7, 0.8, and 0.9 M⊙ were computed for two different initial (ZAMS) metallicities (Z = 0.001 and Z = 0.02). These models represent the expected post-merger configuration of He-WD+He-WD mergers after the rapid phase of helium shell (sub)flashes has already ended.
The models show that, at low metallicities, only stars more massive than about 0.8 M⊙ become giants and go through the location of HE 1518 in the Teff–log g diagram in Fig. 6 (right). Post-merger structures with lower masses evolve directly towards the white dwarf cooling sequence. He-WDs have a maximum mass of about 0.5 M⊙. Consequently, a He-WD+He-WD merger has a maximum theoretical mass of about 1 M⊙. Based on these theoretical arguments, we deduce that the mass of HE 1518 has to be 0.9 ± 0.1 M⊙.
This establishes HE 1518 as the first hot subdwarf identified on the ascending helium giant branch and provides compelling evidence that helium-rich sdO stars form through the merger of two helium white dwarfs. The enhanced carbon abundance in the star indicates that it was a violent merger with temperatures high enough to ignite some of the helium during this process (Zhang & Jeffery 2012; Yu et al. 2021).
8.2. The future evolution of HE 1518
The majority of hot subdwarfs have masses close to 0.5 M⊙. After their core helium burning phase, they directly evolve towards hotter temperatures before entering the white dwarf cooling track. Helium stars with masses greater than 0.8 M⊙ have envelopes that are thick enough such that the helium burning shell around the degenerate C/O core leads to another phase of expansion where they ascend towards the helium giants.
If HE 1518 is currently ascending the helium giant branch, it might not reach the giant phase because of its low metallicity. The track for a 0.8 M⊙ star is already starting to contract again after cooling to around 40 000 K. However, if it is more massive than 0.8 M⊙, its temperature will further decrease, while the luminosity increases. In case it reaches a temperature range between 35 000 and 8000 K, its spectrum will resemble that of an EHe star (Jeffery 2008).
When it cools down even further, it enters the domain of hydrogen-deficient carbon stars (HdCs). These stars are helium giants that are cool enough such that carbon dust grains can condense in their outer atmosphere, releasing a highly variable dust-driven wind with high mass-loss episodes (Clayton et al. 2013) as seen in R CrB stars. Such stars are usually believed to originate from a merger of a C/O-WD+He-WD (Webbink 1984), but massive double He-WD merger products such as HE 1518 might also contribute to this population.
After the end of helium shell burning, HE 1518 will rapidly evolve towards the white dwarf cooling track. During this evolution the star contracts causing the temperature to increase, whereas the luminosity remains nearly constant. It will evolve through a second, but now more luminous, EHe phase before being visible as an O(He) star. These stars represent the very hot, low-gravity, pre-WD phase before entering the WD cooling track (Reindl et al. 2014).
8.3. Enrichment with nuclear-processed matter
A small number of hot subdwarfs exhibit strong enrichments of heavy elements produced by the i-process (Dorsch et al. 2022; Battich et al. 2025). In particular, LS IV−14° 116 and Feige 46 (Dorsch et al. in prep.) are single stars, and therefore plausible merger products. Moreover, the analysis of UV/FUSE spectra of three CN-type extreme He-sdO stars (Schindewolf et al. 2018) reveals phosphorus abundances that are qualitatively consistent with the predictions of intermediate neutron captures (Battich et al. 2025). In this scenario, hydrogen is ingested into helium burning layers leading to the creation of 13C, which releases a neutron when capturing an α particle. Notably, the only stable phosphorus isotope (31P) can only be formed by neutron captures from seed silicon nuclei or during the post-core helium burning stages in massive stars. The enhanced phosphorus abundance observed in the CN-type He-sdOs studied by Schindewolf et al. (2018) is a hint that neutron capture might also occur in the formation of extreme helium sdOs such as HE 1518. Moreover, their analysis also includes one N-type He-sdO in which this feature is not observed as such stars are not expected to experience an episode of strong helium burning.
Motivated by these facts, we also examined the UV spectrum of HE 1518 for evidence of similar enrichment. However, at the high effective temperature of HE 1518, the relevant absorption lines are intrinsically much weaker than in cooler (Teff ∼ 35 000 K to 40 000 K) heavy-metal subdwarfs, and the star’s rapid rotation broadens and dilutes them further. Therefore, we were unable to find clear evidence of an enrichment in heavy elements, but the upper limits provided in Table 1 would still allow significant enrichment.
Compared to the CN-type objects analysed by Schindewolf et al. (2018), HE 1518 exhibits higher carbon and oxygen abundances. In Fig. 7 we compare our abundance measurements of HE 1518 to the CN-type He-sdO [CW83] 0904 − 02 from Schindewolf et al. (2018). Models of equal-mass mergers by Zhang & Jeffery (2012) predict increasing carbon abundances with higher total masses and lower metallicities. In these models, most of the nitrogen is converted into 18O and 22Ne via α-capture reactions. Thus, a significant fraction of the nitrogen in HE 1518 either survived the merger or was subsequently re-accreted from a disk. The detection of nitrogen in HE 1518 therefore raises the possibility that purely carbon-rich (C-type) He-sdOs may not exist. In this case, the absence of nitrogen in the optical spectra of some He-sdOs may reflect an intrinsically low metallicity rather than the outcome of an uncontaminated hot merger.
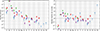 |
Fig. 7. Left: Number fraction of selected elements of HE 1518 (blue points) compared to the He-sdO [CW83] 0904 − 02 from Schindewolf et al. (2018) (red diamonds), the C/O-sdO UCAC4 108 − 030787 (green squares) from Werner et al. (2025), and the extreme helium star LSS 99 (violet pentagons) from Jeffery et al. (1998). The downward pointing arrows indicate the upper limits we estimated for HE 1518. Right: Same as the left plot, but the number fractions are shown relative to solar values. |
We were unable to detect neon in HE 1518, although our upper limit lies well below the abundances measured by Schindewolf et al. (2018). Their analysis also revealed a clear correlation between nitrogen and neon, with ratios 1.6 < nNe/nN < 4. The expected neon abundance in HE 1518 may therefore fall below the detection threshold.
In Fig. 7 we also compare HE 1518 to UCAC4 108 − 030787 (hereafter UCAC4 108), which belongs to the class of recently discovered C/O-sdOs (Werner et al. 2025). These objects are created when a less massive He/C/O hybrid white dwarf merges with a more massive helium white dwarf. The carbon- and oxygen-rich material is then visible on the surface of the merger product (Miller Bertolami et al. 2022). Only three of these objects have been observed so far (Werner et al. 2022, 2025). In comparison to HE 1518 the stars have similar temperatures, but higher surface gravities and lower luminosities. Of these stars UCAC4 108 has the lowest carbon and oxygen fraction, but they are still three times larger compared to HE 1518.
The star LSS 99 belongs to the luminous class of extreme helium stars (Philip Monai et al. 2024), which are thought to originate from C/O-WD+He-WD mergers. It was analysed by Jeffery et al. (1998), and is also a metal-poor object. Its abundance pattern is shown in Fig. 7. Among the comparison objects, LSS 99 shows the closest agreement with the abundance pattern of HE 1518, although its carbon and oxygen abundances are lower. As in HE 1518, silicon and sulphur are enhanced relative to iron, which is typical in metal-poor stars. Unlike the CN-type He-sdO [CW83] 0904 − 02, LSS 99 does not exhibit a phosphorus overabundance relative to silicon and sulphur.
In contrast to the known heavy-metal hot subdwarfs, stars such as HE 1518 may have the potential to release the created elements into the interstellar medium (ISM). If HE 1518 reaches the R CrB stage, the heavy elements would be expelled by the dust-driven wind that can reach mass-loss rates of up to 10−6 M⊙ yr−1 (Clayton et al. 2013). However, there also exists a population of dustless HdC (dLHdC) stars that have the same spectral characteristics as R CrB stars, but appear less luminous (Tisserand et al. 2022) and, due to their lack of dust, show no evidence of strong mass loss (Geballe et al. 2009). Whether these objects represent a permanent evolutionary state or a quiescent phase during R CrB evolution is currently unknown, although some exhibit indications of recent dust formation (Tisserand et al. 2022).
In our 0.9 M⊙ model, the R CrB phase lasts approximately 100 kyr, comparable to the lifetimes of the R CrB models produced by C/O-WD+He-WD mergers in Crawford et al. (2024). Over this period, such stars can return up to 0.1 M⊙ of material, which is potentially enriched, to the ISM. Some R CrB and dLHdC stars show strong enrichments of Sr, Y, and Ba that can only be created during the merger process because afterwards the convective envelope is disconnected from the helium buring shell (Crawford et al. 2022). If the i-process can also occur in C/O-WD+He-WD mergers, then R CrB stars could be a significant source in the production of heavy elements. A detailed study is beyond the scope of this paper, but is a compelling topic for future research.
8.4. Why HE 1518 rotates so fast
One of the distinctive features of HE 1518 is the fast projected rotational velocity of the star of 90 ± 20 km s−1. This is even more remarkable because the star expanded already, and therefore has a radius that is around three times larger than its core helium burning radius. Thus, assuming angular momentum conservation, the star would have rotated at ∼200–300 km s−1 on the He-ZAMS, substantially faster than the majority of He-sdOs analysed by Hirsch (2009). For their sample, typical projected rotational velocities of v sin i = 20–30 km s−1 were measured, in agreement with theoretical He-WD+He-WD merger models by Schwab (2018). In their sample of 34 He-sdOs they report a projected rotational velocity above 100 km s−1 only for one star (PG 1632+223). Therefore, only a small fraction of He-sdOs seem to be very fast rotators. This also includes the ejected hot subdwarf US 708 which was likely spun up in a very close binary and not formed by a merger (Geier et al. 2015).
C-type objects are expected to form predominantly through hot mergers. In this picture, the merger of two helium white dwarfs of nearly equal mass should provide the most favourable conditions for producing a carbon-rich remnant. This might also provide a potential explanation for the high rotational velocity of HE 1518. Theoretical predictions suggest that in nearly-equal-mass mergers the resulting accretion disk around the newly formed object might only contain small amounts of mass (Lorén-Aguilar et al. 2009; Dan et al. 2014), which would help to preserve a high rotational velocity because angular momentum is transported outwards in the disk, causing the stars to spin down.
This is in agreement with the results of Hirsch (2009) who found that the N-type He-sdOs have on average a smaller rotational velocity compared to the CN- and C-type objects. The N-type He-sdOs are created in slow merger events (Zhang & Jeffery 2012) where the material is accreted from a disk created by the disruption of the lower-mass star. Hirsch (2009) were able to measure a rotational velocity of more than 10 km s−1 only in one-third of the N-type objects, which was their detection limit.
8.5. Potential misinterpretations
Due to its high effective temperature and luminosity, the position of HE 1518 in the Hertzsprung–Russell diagram (HRD) overlaps with that expected for more massive hot subdwarfs formed through the stripping of intermediate-mass stars. Objects with spectra similar to HE 1518 have recently been identified in the Large Magellanic Cloud by Drout et al. (2023) and Götberg et al. (2023), and are most likely also ascending the helium giant branch. Consequently, massive He-WD+He-WD and C/O-WD+He-WD mergers should be considered when interpreting populations of apparently more massive hot subdwarfs created through binary stripping. These merger products can be distinguished by their extreme helium enrichment, absence of detectable hydrogen, and strong carbon features, whereas binary-stripped stars such as the massive He-sdO+WD binary HD 49798 typically retain significant hydrogen and show a CNO burning pattern (N-rich, C/O-poor) (Rauch & Strauß 2025).
Furthermore, the star might also be confused as a runaway. With a disk-crossing velocity of  and its high rotational velocity, it resembles the predicted properties of type Ia supernova-ejected hot subdwarfs described by Neunteufel et al. (2022). Only its low metallicity reveals that the star belongs to the intrinsic halo population.
These examples show that stars similar to HE 1518 might be misidentified as different objects if abundances are not taken into account.
9. Summary and conclusions
We performed a detailed analysis of the luminous He-sdO HE 1518. A comparison of its position in the Teff–log g diagram with evolutionary tracks for stripped binary stars, VLTP objects, and C/O-WD+He-WD and He-WD+He-WD merger scenarios indicates that a double He-WD merger provides the most plausible formation channel, despite the star’s unusually low log g relative to most known He-sdOs. The evolutionary tracks reveal that HE 1518 is currently undergoing helium shell burning, thus causing it to ascend the helium giant branch. With an inferred mass of at least 0.8 M⊙, it is close to the upper mass limit that a double He-WD merger can reach. In comparison to the majority of known He-sdOs, the star has an outstandingly high rotational velocity.
We derived accurate abundances for He, C, N, O, Si, S, and Fe, and determined upper limits for H, Ne, Mg, P, Ar, Ti, Cr, Mn, Co, Ni, Zn, Ge, Zr, Sr, and Pb by fitting optical and UV spectra. The resulting chemical composition indicates a very low metallicity, consistent with the halo orbit of HE 1518. Due to its high effective temperature and rapid rotation, we were unable to identify signatures of i-process nucleosynthesis that is observed in a few intermediate helium-rich hot subdwarfs. The star is enriched in carbon and oxygen similar to other CN-type He-sdOs. It shows signatures of a weak stellar wind making it a unique helium-rich object in an extremely low-metallicity environment well suited to study wind models.
To further constrain the formation channel of HE 1518-like stars, a larger sample is required, enabling a systematic comparison with the population of double He-WD binaries. This progenitor population also has to be constrained. We identify two candidate double He-WD systems, WD 0455−295 (Napiwotzki et al. 2020) and Gaia DR3 928585329693880832 (Brown et al. 2022), that are expected to merge within a Hubble time and may thus form a He-sdO massive enough to ascend the helium giant branch. Similar WD binaries have been reported by Munday et al. (2025), although their longer orbital periods imply merger timescales exceeding a Hubble time.
Acknowledgments
MD was supported by the Deutsches Zentrum für Luft- und Raumfahrt (DLR) through grant 50-OR-2510. MP received funding by the Deutsche Forschungs- gemeinschaft (DFG) through grants GE2506/9-1, GE2506/12-1, and GE2506/18-1. HD was supported by the DFG through grant GE2506/9-2. Part of this work was supported by the CONICET-DAAD 2022 bilateral cooperation grant number 80726. M3B is partially funded by CONICET and Agencia I+D+i through grants PIP-2971 and PICT 2020-03316. Based on observations made with the Isaac Newton and William Herschel telescopes operated on the island of La Palma by the Isaac Newton Group of Telescopes in the Spanish Observatorio del Roque de los Muchachos of the Instituto de Astrofísica de Canarias. Based on observations made with ESO Telescopes at the La Silla Paranal Observatory under programme IDs 167.D-0407(A) and 71.D-0380(A). Based on observations obtained at the Southern Astrophysical Research (SOAR) telescope, which is a joint project of the Ministério da Ciência, Tecnologia e Inovações (MCTI/LNA) do Brasil, the US National Science Foundation’s NOIRLab, the University of North Carolina at Chapel Hill (UNC), and Michigan State University (MSU). This research is based on observations made with the NASA/ESA Hubble Space Telescope obtained from the Space Telescope Science Institute, which is operated by the Association of Universities for Research in Astronomy, Inc., under NASA contract NAS 5–26555. These observations are associated with program A far-UV treasury survey for hot subdwarf stars (ID 17697; PI: M.Dorsch)
References
- Allen, C., & Santillan, A. 1991, Rev. Mex. Astron. Astrofis., 22, 255 [NASA ADS] [Google Scholar]
- Asplund, M., Grevesse, N., Sauval, A. J., & Scott, P. 2009, ARA&A, 47, 481 [NASA ADS] [CrossRef] [Google Scholar]
- Baran, A. S., & Koen, C. 2021, Acta Astron., 71, 113 [Google Scholar]
- Battich, T., Miller Bertolami, M. M., Córsico, A. H., & Althaus, L. G. 2018, A&A, 614, A136 [NASA ADS] [CrossRef] [EDP Sciences] [Google Scholar]
- Battich, T., Miller Bertolami, M. M., Weiss, A., et al. 2025, A&A, 699, A298 [NASA ADS] [CrossRef] [EDP Sciences] [Google Scholar]
- Brown, W. R., Kilic, M., Kosakowski, A., & Gianninas, A. 2022, ApJ, 933, 94 [NASA ADS] [CrossRef] [Google Scholar]
- Cioni, M. R. L., Clementini, G., Girardi, L., et al. 2011, A&A, 527, A116 [CrossRef] [EDP Sciences] [Google Scholar]
- Clayton, G. C., Geballe, T. R., & Zhang, W. 2013, AJ, 146, 23 [NASA ADS] [CrossRef] [Google Scholar]
- Copperwheat, C. M., Morales-Rueda, L., Marsh, T. R., Maxted, P. F. L., & Heber, U. 2011, MNRAS, 415, 1381 [Google Scholar]
- Crawford, C. L., Tisserand, P., Clayton, G. C., & Munson, B. 2022, A&A, 667, A85 [NASA ADS] [CrossRef] [EDP Sciences] [Google Scholar]
- Crawford, C. L., Nikultsev, N., Clayton, G. C., et al. 2024, MNRAS, 534, 1018 [Google Scholar]
- Culpan, R., Geier, S., Reindl, N., et al. 2022, A&A, 662, A40 [NASA ADS] [CrossRef] [EDP Sciences] [Google Scholar]
- Cutri, R. M., Skrutskie, M. F., van Dyk, S., et al. 2003, VizieR On-line Data Catalog: II/246 [Google Scholar]
- Cutri, R. M., Wright, E. L., Conrow, T., et al. 2021, VizieR On-line Data Catalog: II/328 [Google Scholar]
- Dan, M., Rosswog, S., Brüggen, M., & Podsiadlowski, P. 2014, MNRAS, 438, 14 [NASA ADS] [CrossRef] [Google Scholar]
- Dawson, H., Dorsch, M., Geier, S., et al. 2026, A&A, 707, A6 [NASA ADS] [CrossRef] [EDP Sciences] [Google Scholar]
- DENIS Consortium 2005, VizieR On-line Data Catalog: B/denis [Google Scholar]
- Dorsch, M. 2024, Ph.D. Thesis, Friedrich Alexander University of Erlangen-Nuremberg, Germany [Google Scholar]
- Dorsch, M., Latour, M., Heber, U., et al. 2020, A&A, 643, A22 [EDP Sciences] [Google Scholar]
- Dorsch, M., Jeffery, C. S., Irrgang, A., Woolf, V., & Heber, U. 2021, A&A, 653, A120 [NASA ADS] [CrossRef] [EDP Sciences] [Google Scholar]
- Dorsch, M., Reindl, N., Pelisoli, I., et al. 2022, A&A, 658, L9 [NASA ADS] [CrossRef] [EDP Sciences] [Google Scholar]
- Drout, M. R., Götberg, Y., Ludwig, B. A., et al. 2023, Science, 382, 1287 [NASA ADS] [CrossRef] [Google Scholar]
- El-Badry, K., Rix, H.-W., & Heintz, T. M. 2021, MNRAS, 506, 2269 [NASA ADS] [CrossRef] [Google Scholar]
- Fitzpatrick, E. L., Massa, D., Gordon, K. D., Bohlin, R., & Clayton, G. C. 2019, ApJ, 886, 108 [Google Scholar]
- Gaia Collboration 2022, VizieR On-line Data Catalog: I/355 [Google Scholar]
- Gaia Collboration (Vallenari, A., et al.) 2023, A&A, 674, A1 [NASA ADS] [CrossRef] [EDP Sciences] [Google Scholar]
- Geballe, T. R., Rao, N. K., & Clayton, G. C. 2009, ApJ, 698, 735 [NASA ADS] [CrossRef] [Google Scholar]
- Geier, S., Hirsch, H., Tillich, A., et al. 2011, A&A, 530, A28 [NASA ADS] [CrossRef] [EDP Sciences] [Google Scholar]
- Geier, S., Fürst, F., Ziegerer, E., et al. 2015, Science, 347, 1126 [Google Scholar]
- Geier, S., Dorsch, M., Pelisoli, I., et al. 2022, A&A, 661, A113 [NASA ADS] [CrossRef] [EDP Sciences] [Google Scholar]
- Götberg, Y., de Mink, S. E., Groh, J. H., et al. 2018, A&A, 615, A78 [NASA ADS] [CrossRef] [EDP Sciences] [Google Scholar]
- Götberg, Y., Drout, M. R., Ji, A. P., et al. 2023, ApJ, 959, 125 [CrossRef] [Google Scholar]
- Han, Z., Podsiadlowski, P., Maxted, P. F. L., Marsh, T. R., & Ivanova, N. 2002, MNRAS, 336, 449 [Google Scholar]
- Han, Z., Podsiadlowski, P., Maxted, P. F. L., & Marsh, T. R. 2003, MNRAS, 341, 669 [NASA ADS] [CrossRef] [Google Scholar]
- He, R., Meng, X., Lei, Z., Yan, H., & Lan, S. 2025, A&A, 693, A121 [NASA ADS] [CrossRef] [EDP Sciences] [Google Scholar]
- Heber, U. 2016, PASP, 128, 082001 [Google Scholar]
- Heber, U. 2026, Encyclopedia Astrophys., 2, 488 [Google Scholar]
- Heber, U., Irrgang, A., & Schaffenroth, J. 2018, Open Astron., 27, 35 [Google Scholar]
- Heber, U., Kufleitner, L., Dorsch, M., et al. 2026, A&A, 708, A115 [NASA ADS] [CrossRef] [EDP Sciences] [Google Scholar]
- Hirsch, H. A. 2009, Ph.D. Thesis, Friedrich Alexander University of Erlangen-Nuremberg, Germany [Google Scholar]
- Houck, J. C., & Denicola, L. A. 2000, ASP Conf. Ser., 216, 591 [Google Scholar]
- Hubeny, I., & Lanz, T. 2017, ArXiv e-prints [arXiv:1706.01859] [Google Scholar]
- Irrgang, A., Wilcox, B., Tucker, E., & Schiefelbein, L. 2013, A&A, 549, A137 [NASA ADS] [CrossRef] [EDP Sciences] [Google Scholar]
- Irrgang, A., Przybilla, N., Heber, U., et al. 2014, A&A, 565, A63 [NASA ADS] [CrossRef] [EDP Sciences] [Google Scholar]
- Jahn, D., Rauch, T., Reiff, E., et al. 2007, A&A, 462, 281 [NASA ADS] [CrossRef] [EDP Sciences] [Google Scholar]
- Jeffery, C. S. 2008, ASP Conf. Ser., 391, 53 [NASA ADS] [Google Scholar]
- Jeffery, C. S., Hamill, P. J., Harrison, P. M., & Jeffers, S. V. 1998, A&A, 340, 476 [NASA ADS] [Google Scholar]
- Jeffery, C. S., Karakas, A. I., & Saio, H. 2011, MNRAS, 414, 3599 [NASA ADS] [CrossRef] [Google Scholar]
- Jeffery, C. S., Miszalski, B., & Snowdon, E. 2021, MNRAS, 501, 623 [Google Scholar]
- Jeffery, C. S., Monageng, I., Miszalski, B., et al. 2023, Bull. Soc. Roy. Sci. Liege, 92, 11209 [Google Scholar]
- Jeffery, C. S., Dorsch, M., Philip Monai, A., et al. 2026, MNRAS, 546, staf2202 [Google Scholar]
- Justham, S., Podsiadlowski, P., & Han, Z. 2011, MNRAS, 410, 984 [CrossRef] [Google Scholar]
- Kawka, A., Vennes, S., O’Toole, S., et al. 2015, MNRAS, 450, 3514 [Google Scholar]
- Kupfer, T., Geier, S., Heber, U., et al. 2015, A&A, 576, A44 [NASA ADS] [CrossRef] [EDP Sciences] [Google Scholar]
- Kupfer, T., van Roestel, J., Brooks, J., et al. 2017, ApJ, 835, 131 [NASA ADS] [CrossRef] [Google Scholar]
- Kupfer, T., Bauer, E. B., Burdge, K. B., et al. 2020a, ApJ, 898, L25 [Google Scholar]
- Kupfer, T., Bauer, E. B., Marsh, T. R., et al. 2020b, ApJ, 891, 45 [Google Scholar]
- Kupfer, T., Bauer, E. B., van Roestel, J., et al. 2022, ApJ, 925, L12 [NASA ADS] [CrossRef] [Google Scholar]
- Lanz, T., Hubeny, I., & Heap, S. R. 1997, ApJ, 485, 843 [NASA ADS] [CrossRef] [Google Scholar]
- Lanz, T., Brown, T. M., Sweigart, A. V., Hubeny, I., & Landsman, W. B. 2004, ApJ, 602, 342 [CrossRef] [Google Scholar]
- Latour, M., Fontaine, G., Green, E. M., & Brassard, P. 2015, A&A, 579, A39 [NASA ADS] [CrossRef] [EDP Sciences] [Google Scholar]
- Latour, M., Green, E. M., Dorsch, M., et al. 2026, A&A, 705, A248 [Google Scholar]
- Lindegren, L., Bastian, U., Biermann, M., et al. 2021, A&A, 649, A4 [EDP Sciences] [Google Scholar]
- Löbling, L., Rauch, T., Miller Bertolami, M. M., et al. 2019, MNRAS, 489, 1054 [CrossRef] [Google Scholar]
- Lorén-Aguilar, P., Isern, J., & García-Berro, E. 2009, A&A, 500, 1193 [NASA ADS] [CrossRef] [EDP Sciences] [Google Scholar]
- Luo, Y., Németh, P., Wang, K., Wang, X., & Han, Z. 2021, ApJS, 256, 28 [NASA ADS] [CrossRef] [Google Scholar]
- Luo, Y., Németh, P., Wang, K., & Pan, Y. 2024, ApJS, 271, 21 [NASA ADS] [CrossRef] [Google Scholar]
- Marocco, F., Eisenhardt, P. R. M., & Fowler, J. W. 2020, VizieR On-line Data Catalog: II/365 [Google Scholar]
- Maxted, P. F. L., Heber, U., Marsh, T. R., & North, R. C. 2001, MNRAS, 326, 1391 [CrossRef] [Google Scholar]
- McMahon, R. G., Banerji, M., Gonzalez, E., et al. 2013, The Messenger, 154, 35 [NASA ADS] [Google Scholar]
- Miller Bertolami, M. M. 2016, A&A, 588, A25 [NASA ADS] [CrossRef] [EDP Sciences] [Google Scholar]
- Miller Bertolami, M. M., & Althaus, L. G. 2006, A&A, 454, 845 [NASA ADS] [CrossRef] [EDP Sciences] [Google Scholar]
- Miller Bertolami, M. M., Althaus, L. G., Unglaub, K., & Weiss, A. 2008, A&A, 491, 253 [NASA ADS] [CrossRef] [EDP Sciences] [Google Scholar]
- Miller Bertolami, M. M., Battich, T., Córsico, A. H., Althaus, L. G., & Wachlin, F. C. 2022, MNRAS, 511, L60 [NASA ADS] [CrossRef] [Google Scholar]
- Moehler, S., Richtler, T., de Boer, K. S., Dettmar, R. J., & Heber, U. 1990, A&AS, 86, 53 [Google Scholar]
- Munday, J., Pelisoli, I., Tremblay, P.-E., et al. 2025, MNRAS, 541, 3494 [Google Scholar]
- Napiwotzki, R., Karl, C. A., Lisker, T., et al. 2020, A&A, 638, A131 [NASA ADS] [CrossRef] [EDP Sciences] [Google Scholar]
- Németh, P., Kawka, A., & Vennes, S. 2012, MNRAS, 427, 2180 [Google Scholar]
- Neunteufel, P., Preece, H., Kruckow, M., et al. 2022, A&A, 663, A91 [NASA ADS] [CrossRef] [EDP Sciences] [Google Scholar]
- Onken, C. A., Wolf, C., Bessell, M. S., et al. 2024, PASA, 41, e061 [NASA ADS] [CrossRef] [Google Scholar]
- Paczyński, B. 1971, Acta Astron., 21, 1 [NASA ADS] [Google Scholar]
- Pelisoli, I., Vos, J., Geier, S., Schaffenroth, V., & Baran, A. S. 2020, A&A, 642, A180 [NASA ADS] [CrossRef] [EDP Sciences] [Google Scholar]
- Philip Monai, A., Martin, P., & Jeffery, C. S. 2024, MNRAS, 527, 5408 [Google Scholar]
- Rajamuthukumar, A. S., Bauer, E. B., Justham, S., et al. 2025, A&A, 704, A82 [NASA ADS] [CrossRef] [EDP Sciences] [Google Scholar]
- Rauch, T., & Strauß, P. 2025, A&A, 700, A80 [NASA ADS] [CrossRef] [EDP Sciences] [Google Scholar]
- Reindl, N., Rauch, T., Werner, K., Kruk, J. W., & Todt, H. 2014, A&A, 566, A116 [NASA ADS] [CrossRef] [EDP Sciences] [Google Scholar]
- Reindl, N., Geier, S., Kupfer, T., et al. 2016, A&A, 587, A101 [NASA ADS] [CrossRef] [EDP Sciences] [Google Scholar]
- Reindl, N., Rauch, T., Miller Bertolami, M. M., Todt, H., & Werner, K. 2017, MNRAS, 464, L51 [NASA ADS] [CrossRef] [Google Scholar]
- Renzo, M., Zapartas, E., de Mink, S. E., et al. 2019, A&A, 624, A66 [NASA ADS] [CrossRef] [EDP Sciences] [Google Scholar]
- Saio, H., & Jeffery, C. S. 2002, MNRAS, 333, 121 [CrossRef] [Google Scholar]
- Schindewolf, M., Németh, P., Heber, U., et al. 2018, A&A, 620, A36 [NASA ADS] [CrossRef] [EDP Sciences] [Google Scholar]
- Schlafly, E. F., Meisner, A. M., & Green, G. M. 2019, ApJS, 240, 30 [Google Scholar]
- Schwab, J. 2018, MNRAS, 476, 5303 [Google Scholar]
- Shanks, T., Metcalfe, N., Chehade, B., et al. 2015, MNRAS, 451, 4238 [NASA ADS] [CrossRef] [Google Scholar]
- Snowdon, E. J., Jeffery, C. S., Schlagenhauf, S., & Dorsch, M. 2025, MNRAS, 537, 2079 [Google Scholar]
- Stringer, E., Kupfer, T., & Dorsch, M. 2023, Bull. Soc. Roy. Sci. Liege, 92, 11283 [Google Scholar]
- Stroeer, A., Heber, U., Lisker, T., et al. 2007, A&A, 462, 269 [NASA ADS] [CrossRef] [EDP Sciences] [Google Scholar]
- Tisserand, P., Crawford, C. L., Clayton, G. C., et al. 2022, A&A, 667, A83 [NASA ADS] [CrossRef] [EDP Sciences] [Google Scholar]
- Webbink, R. F. 1984, ApJ, 277, 355 [NASA ADS] [CrossRef] [Google Scholar]
- Werner, K., Rauch, T., & Kruk, J. W. 2016, A&A, 593, A104 [NASA ADS] [CrossRef] [EDP Sciences] [Google Scholar]
- Werner, K., Rauch, T., & Kruk, J. W. 2018, A&A, 609, A107 [NASA ADS] [CrossRef] [EDP Sciences] [Google Scholar]
- Werner, K., Reindl, N., Geier, S., & Pritzkuleit, M. 2022, MNRAS, 511, L66 [NASA ADS] [CrossRef] [Google Scholar]
- Werner, K., Reindl, N., Pritzkuleit, M., & Geier, S. 2025, A&A, 693, A167 [NASA ADS] [CrossRef] [EDP Sciences] [Google Scholar]
- Yu, J., Zhang, X., & Lü, G. 2021, MNRAS, 504, 2670 [NASA ADS] [CrossRef] [Google Scholar]
- Zhang, X., & Jeffery, C. S. 2012, MNRAS, 419, 452 [NASA ADS] [CrossRef] [Google Scholar]
The grid assumes solar abundances, except for C (2×), O (0.1×), Ne (2×), Fe (1.5×), and Ni (10× solar); enhanced Fe and Ni compensate for the omission of other iron-group elements.
Appendix A: Additional tables and figures
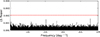 |
Fig. A.1. Periodogram of HE1518. The red dotted line outlines our FAP threshold corresponding to a S/N of ≈ 5. Aliasing effects caused by gaps in the time series data dominate the low-frequency regime corresponding to periods longer than 3 days, and we therefore truncate the periodogram accordingly. These results show no indication of variability above the significance threshold. |
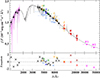 |
Fig. A.2. SED fitting performed using photometry from the following surveys covering the UV to infrared range: the HST/STIS spectrum, Gaia XP spectra, and G/GBP/GRP photometry (Gaia Collboration 2022); VISTA (Cioni et al. 2011; McMahon et al. 2013); VST (Shanks et al. 2015); Skymapper (Onken et al. 2024); DENIS (DENIS Consortium 2005); 2MASS (Cutri et al. 2003); and WISE (Cutri et al. 2021; Schlafly et al. 2019; Marocco et al. 2020). |
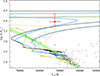 |
Fig. A.3. Position of HE 1518 in the HRD. The tracks and meaning of the colours is the same as in Fig. 6 (right). |
Observations of HE 1518-0948
Lines used to determine upper abundance limits.
All Tables
All Figures
|
Fig. 1. Spectral fit of the optical UVES spectrum (black). The model is overplotted (red). |
| In the text | |
|
Fig. 2. Selected UV lines of carbon, nitrogen, oxygen, silicon, sulphur, and iron. The black line is the observation, red shows the model, and light blue further includes interstellar lines. |
| In the text | |
|
Fig. 3. UV lines of C, N, and O affected by the stellar wind of HE 1518. The meaning of the colours is the same as in Fig. 2. |
| In the text | |
|
Fig. 4. Abundance comparison for lead. The blue model includes all abundances as measured from the χ2 fitting, while the red line is the model without lead. Because there is no unambiguous line identification, we consider this only as an upper limit. This technique was also used for all other elements for which we provide upper limits. |
| In the text | |
|
Fig. 5. Toomre diagram with HE 1518-0948 marked in red using the spectroscopic distance. In gold, we show its position when using the parallax distance. The blue, green, and grey dotted areas represent the thin disk, thick disk, and halo contours. As a comparison we show the positions of the known He-sdOs from Dorsch (2024), based on the Culpan et al. (2022) sample. The colour-coding is the same as for the contours and represents their Galactic population membership. The position of the Sun is shown as a pink circle. |
| In the text | |
|
Fig. 6. Left: Kiel diagram of HE 1518 illustrating several evolutionary tracks that intersect this region of the diagram. The black solid lines show post-merger evolutionary tracks of C/O+He white dwarf mergers with total masses of 0.7, 0.8, and 0.9 M⊙ from Saio & Jeffery (2002). The orange dashed line represents the evolution of an initially 7.4 M⊙ star stripped by a companion from Götberg et al. (2018), resulting in a helium star with a mass of approximately 1.9 M⊙. The blue line shows the evolution of a star that experienced a very late thermal pulse (VLTP) and is contracting towards higher effective temperatures to enter the white dwarf cooling track from Miller Bertolami & Althaus (2006). The model shown has a mass of 0.51 M⊙. The violet line corresponds to the evolution of a double helium white dwarf merger from Yu et al. (2021), in which both components have masses of 0.45 M⊙. The light green region indicates the location of the He-ZAMS from Paczyński (1971) for helium stars with masses between 0.6 and ∼2.0 M⊙ The arrows indicate the direction of evolution for the corresponding tracks. Right: Stellar evolution for helium stars with 0.7 (gold), 0.8 (blue), and 0.9 M⊙ (black) for two different metallicities Z = 0.001 (solid line) and Z = 0.02 (dashed line; for more details see Sect. 8.1). The grey dots are the observed helium-rich hot subdwarfs in the SALT survey of hydrogen-deficient stars (Jeffery et al. 2026, preliminary results). |
| In the text | |
|
Fig. 7. Left: Number fraction of selected elements of HE 1518 (blue points) compared to the He-sdO [CW83] 0904 − 02 from Schindewolf et al. (2018) (red diamonds), the C/O-sdO UCAC4 108 − 030787 (green squares) from Werner et al. (2025), and the extreme helium star LSS 99 (violet pentagons) from Jeffery et al. (1998). The downward pointing arrows indicate the upper limits we estimated for HE 1518. Right: Same as the left plot, but the number fractions are shown relative to solar values. |
| In the text | |
|
Fig. A.1. Periodogram of HE1518. The red dotted line outlines our FAP threshold corresponding to a S/N of ≈ 5. Aliasing effects caused by gaps in the time series data dominate the low-frequency regime corresponding to periods longer than 3 days, and we therefore truncate the periodogram accordingly. These results show no indication of variability above the significance threshold. |
| In the text | |
|
Fig. A.2. SED fitting performed using photometry from the following surveys covering the UV to infrared range: the HST/STIS spectrum, Gaia XP spectra, and G/GBP/GRP photometry (Gaia Collboration 2022); VISTA (Cioni et al. 2011; McMahon et al. 2013); VST (Shanks et al. 2015); Skymapper (Onken et al. 2024); DENIS (DENIS Consortium 2005); 2MASS (Cutri et al. 2003); and WISE (Cutri et al. 2021; Schlafly et al. 2019; Marocco et al. 2020). |
| In the text | |
|
Fig. A.3. Position of HE 1518 in the HRD. The tracks and meaning of the colours is the same as in Fig. 6 (right). |
| In the text | |
Current usage metrics show cumulative count of Article Views (full-text article views including HTML views, PDF and ePub downloads, according to the available data) and Abstracts Views on Vision4Press platform.
Data correspond to usage on the plateform after 2015. The current usage metrics is available 48-96 hours after online publication and is updated daily on week days.
Initial download of the metrics may take a while.