Fig. 11
Download original image
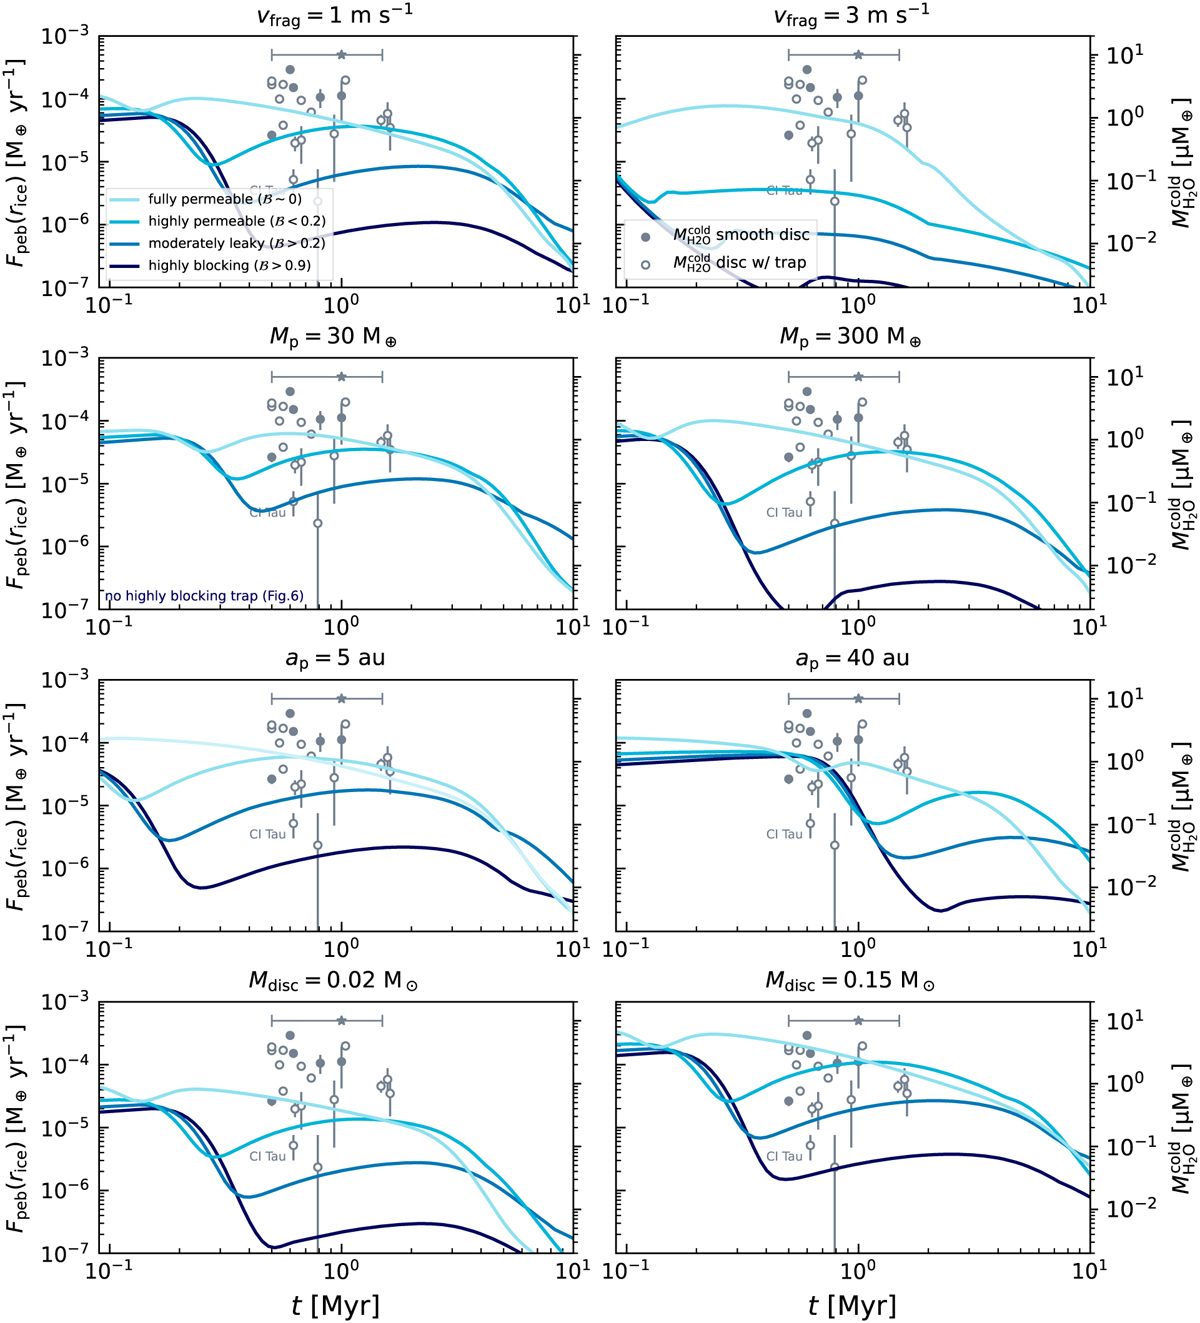
Pebble flux through the iceline (left axis) and observable cold water vapour mass (right axis) versus time for different dust trap leakiness and parameters. The different colours indicate simulations with δturb = 10−4 and varying viscosity from αvisc = 10−3 (most blocking, dark blue) to αvisc = 10−2 (fully permeable, light blue). We present these four cases because as seen in Fig. 6, varying the viscosity across this column samples well the different leakiness regimes. Note that for weak traps (e.g. with Mp = 30 M⊕), even the most blocking trap is quite leaky. Grey dots indicate measurements of the vapour reservoir made with JWST (see Figure 2 in Krijt et al. 2025) and converted into pebble flux following Eq. (6). The title of each panel indicates the parameter that is varied from the standard fiducial values: vfrag = 1 m s−1, Mp = 100 M⊕, ap = 10 au and Mdisc = 0.05 M⊙. The grey star label and horizontal line indicate an estimate of the error on the disc age (~0.5 Myr, Krijt et al. 2025).
Current usage metrics show cumulative count of Article Views (full-text article views including HTML views, PDF and ePub downloads, according to the available data) and Abstracts Views on Vision4Press platform.
Data correspond to usage on the plateform after 2015. The current usage metrics is available 48-96 hours after online publication and is updated daily on week days.
Initial download of the metrics may take a while.