| Issue |
A&A
Volume 710, June 2026
|
|
|---|---|---|
| Article Number | A79 | |
| Number of page(s) | 19 | |
| Section | Planets, planetary systems, and small bodies | |
| DOI | https://doi.org/10.1051/0004-6361/202659705 | |
| Published online | 03 June 2026 | |
How leaky? A large parameter study of leaky dust traps to quantify the transport of pebbles and ice in protoplanetary discs
1
Center for Star and Planet Formation, Globe Institute, University of Copenhagen,
Øster Voldgade 5-7,
1350
Copenhagen,
Denmark
2
Lund Observatory, Department of Physics, Lund University,
Box 43,
221 00
Lund,
Sweden
3
Department of Physics, Texas State University,
749 North Comanche Street,
San Marcos,
TX
78666,
USA
4
Earth and Planets Laboratory, Carnegie Institution for Science,
5241 Broad Branch Road,
NW,
Washington,
DC
20015,
USA
★ Corresponding author: This email address is being protected from spambots. You need JavaScript enabled to view it.
Received:
4
March
2026
Accepted:
13
April
2026
Abstract
In protoplanetary discs, the presence of dust traps can significantly alter the transport of solids from the outer to the inner regions, and hence they are often invoked as an explanation for the chemical diversity of inner discs observed with the James Webb Space Telescope (e.g. varying oxygen abundances and C/O ratios). As a detailed treatment of dust transport around dust traps is computationally expensive, earlier works investigating the impact of outer traps on the inner disc composition have often used simplified dust models representing the size distribution with a single effective size and drift speed. In this paper, we revisit the impact of outer traps on dust transport using the state-of-the-art one-dimensional dust evolution code DustPy, which simulates the transport and evolution of dust particles including detailed coagulation and fragmentation. We quantify and map the leakiness of dust traps across a broad parameter space, performing over 300 simulations while varying the disc viscosity, turbulence strength, planet mass and location, and dust fragmentation velocity. We find that dust traps are leakier than previously thought, on a broader parameter space, such that most outer traps (r > 5 au) will result in a long-lived oxygen-rich inner disc with gas-phase C/O < 1. In similar conditions (e.g. carved by the same planet mass), we find inner traps are much leakier than outer traps, though their relative efficiency in reducing the pebble flux is time-dependent. Highly blocking traps altering the inner disc composition dramatically (leading, e.g. to C/O > 1) are possible to set up but require low viscosity (αvisc ≤ 10−3) and weak turbulence (δturb ≤ 10−4), along with efficient planetesimal formation by the streaming instability. In that case, we find that is the formation of planetesimals, rather than the dust traps themselves, that is capable of significantly altering the inner disc composition.
Key words: planets and satellites: composition / planets and satellites: formation / protoplanetary disks
© The Authors 2026
 Open Access article, published by EDP Sciences, under the terms of the Creative Commons Attribution License (https://creativecommons.org/licenses/by/4.0), which permits unrestricted use, distribution, and reproduction in any medium, provided the original work is properly cited.
This article is published in open access under the Subscribe to Open model. This email address is being protected from spambots. You need JavaScript enabled to view it. to support open access publication.
1 Introduction
The characterisation of the warm inner (r < 5 au) region of protoplanetary discs from infrared observations offers a unique opportunity to characterise the chemical reservoir of discs and how the observed reservoir may connect to the transport of volatiles by icy pebbles from the outer regions of the disc (Banzatti et al. 2020, 2023). First results obtained with the Spitzer Space Telescope revealed a significant diversity across molecular spectra of the inner part of protoplanetary discs (e.g. Carr & Najita 2008; Pontoppidan et al. 2010; Salyk et al. 2011a,b; Pontoppidan et al. 2014; Banzatti et al. 2017), with, for example, the H2O/HCN ratio varying with stellar mass (Pascucci et al. 2009, 2013) and disc mass (Najita et al. 2013). More recently, the James Webb Space Telescope (JWST) has allowed astronomers to acquire a wealth of infrared data with a much higher sensitivity and spectral resolving power, which confirmed the significant diversity in molecular spectra of inner discs (e.g. Perotti et al. 2023; Xie et al. 2023; Grant et al. 2023; Grant et al. 2024; Colmenares et al. 2024; Frediani et al. 2025; Long et al. 2025; Grant et al. 2025; Arulanantham et al. 2025; Banzatti et al. 2025). Several works have developed models to explain the observed compositional diversity in discs, notably involving dust optical depth effects (Najita et al. 2011; Woitke et al. 2018; Greenwood et al. 2019; Sellek et al. 2025; Houge et al. 2025b), planetesimal formation (Najita et al. 2013; Danti et al. 2023), refractory carbon decomposition (Houge et al. 2025a), and variations in the disc evolution with stellar mass (Mah et al. 2023; Sellek & van Dishoeck 2025). Still, one mechanism has largely been invoked to explain the observed chemical diversity, as it may be very common in discs (Andrews et al. 2018): namely the trapping of dust in outer pressure bumps.
As a result of the sub-Keplerian structure of the gas in protoplanetary discs, millimetre to centimetre-sized particles – so-called pebbles – acquire a radial drift motion that is directed inwards, towards regions of higher pressure (Weidenschilling 1997). Nevertheless, in the presence of a local pressure maxima, such as those arising from the presence of a massive planet carving a gap, inwards-drifting pebbles can become trapped. On top of locally increasing the dust density and facilitating planetesimal formation (Eriksson et al. 2020, 2021), dust traps may prevent the delivery of icy solids to the warm inner disc, where their volatile content sublimates into the gas phase (e.g. Cyr et al. 1998; Cuzzi & Zahnle 2004; Ciesla & Cuzzi 2006; Krijt et al. 2016; Booth et al. 2017; Houge et al. 2025b; Williams et al. 2025; Wang et al. 2025). Depending on the position of the local pressure maximum relative to different icelines, this process controls how pebbles deliver different molecular species to the inner disc, hence resulting in a diversity of chemical inventories (Kalyaan et al. 2021, 2023; Mah et al. 2024; Sellek et al. 2025). Interestingly, a similar mechanism is often invoked in the Solar Nebula to explain the isotopic dichotomy between carbonaceous (CC) and non-carbonaceous (NC) meteorites, based on the assumption that Jupiter may have formed early and carved a gap that separated the disc into two distinct reservoirs (Van Kooten et al. 2016; Kruijer et al. 2017; Alibert et al. 2018; Gurrutxaga et al. 2026).
The underlying assumption behind invoking local pressure maxima to explain the chemical diversity seen with JWST, or the NC and CC dichotomy in the Solar System, is that such traps must trap a significant fraction of the incoming pebble flux from the outer disc. However, there has been a growing amount of evidence that dust traps may be leaky, slowly losing mass and delivering material to the inner disc. Dust traps experience leakage because while pebbles are trapped, small grains remain well coupled to the gas and continue to move inwards with the gas flow. This results in a filtering of particles based on particle size (e.g. Rice et al. 2006; Zhu et al. 2012; Liu et al. 2022; Van Clepper et al. 2025a; Facchini et al. 2026), allowing for a part of the solid mass to leak through the dust trap and make it to the inner disc. While only a small fraction of the total solid mass is stored in small grains, considering the mass exchange between pebbles and small grains via collisional fragmentation dramatically increases the mass flux leaking through the trap (Pinilla et al. 2012, 2016; Drążkowska et al. 2019; Stammler et al. 2023; Pinilla et al. 2024; Homma et al. 2024; Tong et al. 2026). Beyond theory, the leakiness of dust traps has also been suggested from observational measurements, such as the presence of an inner dust disc in PDS 70 (Perotti et al. 2023; Pinilla et al. 2024) and other transition discs (Espaillat et al. 2010; Benisty et al. 2010; Olofsson et al. 2013; Pinilla et al. 2016). In PDS 70, additional evidence of the trap leakiness comes from analysis of the trap width with ALMA Band 9 showing the radial diffusion of small grains (Sierra et al. 2025) along with the inner disc dust composition that is consistent with the mixing of solids from the outer disc reservoir (Jang et al. 2024). Last, the detection and variation in cold water vapour emission measured with JWST in a variety of discs hosting deep or shallow dust traps resolved by ALMA hints that dust traps can be leaky, with varying leakiness depending on trap properties (Banzatti et al. 2023, 2025; Arulanantham et al. 2025; Gasman et al. 2025).
Nevertheless, earlier disc-wide models designed to study the interplay of dust evolution (coagulation, drift) and disc chemistry (sublimation, advection, diffusion) in the presence of substructures (Kalyaan et al. 2021, 2023; Mah et al. 2024; Sellek et al. 2025) found that dust traps can be quite efficient at blocking icy pebbles and controlling the volatile delivery to the inner disc, especially inner traps (Kalyaan et al. 2023; Krijt et al. 2025). In fact, for a variety of trap profiles, Mah et al. (2024) found that the presence of an outer disc dust trap can result in a depletion of oxygen to the inner disc, due to the blocking of icy pebbles, and a gas-phase C/O ratio above unity. However, some of these earlier works focusing on the impact of traps on the inner disc composition used simpler dust evolution models such as the two-population algorithm (two-pop-py, see Birnstiel et al. 2012), which evolves the whole dust size distribution with two particle sizes (small grains and pebbles) moving at a common speed. Though the two-population algorithm has proven effective in modelling smooth discs (Birnstiel et al. 2012), it is not clear how well it performs for discs hosting dust traps as it does not include collisional fragmentation, which is an essential ingredient in the leakiness of dust traps (e.g. Stammler et al. 2023).
To properly assess the role of dust traps in shaping (or not) the chemical diversity measured in the inner part of protoplanetary discs, it is thus required to revise our models of leaky traps with full grain size distribution models, and explore the role of different key parameters in shaping the leakiness. In this work, we therefore perform a large-scale parameter space exploration of dust traps with DustPy (Stammler & Birnstiel 2022), a full grain size distribution code self-consistently simulating the motion of dust of different sizes and the mass exchanges between them, via coagulation and fragmentation. Our goal is to map out how dust traps trap dust and pebbles based on key parameters, quantify leaking across a large variety of possible discs, and identify the different regimes. As such, we aim to show whether dust traps can meaningfully impact spectra obtained with JWST, and if so, in which area of the parameter space sufficient trapping happens.
The paper is organised as follows. In Section 2, we detail our disc model and parameter space exploration with DustPy, along with how we impose our gap profile and calculate planetesimal formation. We present our results in Section 3, starting with a fiducial model to introduce relevant quantities and notions (Section 3.1), before diving into our complete parameter space study (Section 3.2). We discuss the implications of our findings in Section 4, before giving our conclusion in Section 5.
2 Methods
In this section, we describe our model to simulate the evolution of dust particles in a protoplanetary disc hosting a dust trap, along with a description of our parameter space study. We illustrate our approach in Fig. 1.
2.1 Dust and disc model
To self-consistently simulate the evolution of dust particles in a protoplanetary disc with a local pressure maximum (i.e. a dust trap) and the potential leaking of small grains through it, it is necessary to use a state-of-the-art dust evolution code that includes coagulation, fragmentation and transport for a full dust size distribution (Drążkowska et al. 2019). We choose to use the dust evolution code DustPy1 (Stammler & Birnstiel 2022), often used in previous works2 to simulate dust evolution in planet-hosting discs (e.g. Pinilla et al. 2012, 2016; Stammler et al. 2023; Pinilla et al. 2024).
We adopt standard parameters to model the star and the disc, initialising the simulation with a disc of total mass Mdisc = 0.05 M⊙ (gas and dust) surrounding a solar-mass star with a stellar luminosity of 1 L⊙. The disc temperature T is governed by the stellar irradiation (T ∝ r−1/2), and we ignore the contribution of viscous heating, as it may be inefficient if disc winds dominate the angular momentum transport (Mori et al. 2019, 2021). We assume that the initial gas surface density profile follows a tapered power-law (Lynden-Bell & Pringle 1974; Hartmann et al. 1998) with a characteristic radius of Rc = 100 au and power-law of γ = 1. The initial dust-to-gas ratio is set to δd2g = 0.01. We initialise the simulation with a population of dust grains following an MRN size distribution (n(a) ∝ a−3.5, Mathis et al. 1977) from the minimum grain size of 0.1–1 μm grains. The minimum grain size corresponds to that of monomers, which are the building blocks of dust aggregates in protoplanetary discs (Dominik & Tielens 1997; Tazaki & Dominik 2022). We set the fragmentation velocity to vfrag = 1 m s−1 in line with recent experimental and observational works favouring relatively fragile grains (e.g. Gundlach et al. 2018; Musiolik & Wurm 2019; Jiang et al. 2024; Ueda et al. 2024). We also test the case of more resistant dust grains with vfrag = 3 m s−1 in Sect. 3.2.3.
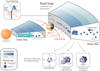 |
Fig. 1 Schematic representing a protoplanetary disc with a gap created by the presence of a giant planet. The gas pressure profile is modified, resulting in the filtering of particles; pebbles are blocked, while small grains leak past the gap. The key processes influencing the leakiness of dust traps included in our work are highlighted. |
2.2 Disentangling viscosity and local turbulence
We separate the viscous disc α-parameter into two components: (1) the global viscosity αvisc, governing the accretion of the disc material through angular momentum transport, and (2) a local turbulence parameter δturb influencing the dust relative velocity and maximum size in the fragmentation-limited regime (Ormel & Cuzzi 2007; Birnstiel et al. 2012) along with the radial and vertical dust diffusion (Semenov & Wiebe 2011; Pinilla et al. 2021). In DustPy, this is done by setting both the radial and vertical dust diffusion parameters, δrad and δvert, equal to δturb, which controls the turbulent collision velocities. This approach allows us to move beyond the standard assumption that the disc turbulence and accretion is controlled by a unique dimensionless parameter α (Shakura & Sunyaev 1973) which has been challenged by recent studies favouring weak local turbulence (δturb ≈ 10−4, e.g. Jiang et al. 2024; Villenave et al. 2025) while the disc accretion rate (10−7–10−10 M⊙ yr−1 Hartmann et al. 2016; Manara et al. 2020) tends to be consistent with higher viscosity (King et al. 2007; Rafikov 2017). Separating global accretion from local turbulence is even more important when considering that MHD winds could be efficient at driving the disc angular momentum transport, in which case one does not require strong local turbulence to explain observed mass accretion rates (Tabone et al. 2022).
2.3 Planetary gap model
Concerning the dust trap, we assume it has a planetary origin3 with the planetary gap profile Fgap(r) (shape and depth) determined by empirical fits derived from 2D hydrodynamic simulations (see Equation (6) in Kanagawa et al. 2017). The planetary gap is thus characterised by the planet mass, Mp, and location, ap, both of which were assumed constant throughout the simulation. We impose the gap profile on the initial gas surface density profile Σg,0(r) and maintain it through the simulation by dividing the initial viscosity, αvisc,0, as αvisc(r) = αvisc,0/Fgap(r), since the product of the gas surface density by the viscosity is constant in a quasi steady-state (a consequence of constant mass flux ![Mathematical equation: $\[\dot{M}\]$](/articles/aa/full_html/2026/06/aa59705-26/aa59705-26-eq1.png) across the gap, see Kanagawa et al. 2017; Duffell 2020; Wafflard-Fernandez & Lesur 2023). The local turbulence δturb controlling particle size and diffusion is not affected by the gap profile, hence it is kept constant in our models. In Fig. 2, we show the radial profile of the initial gas surface density, Σg,0(r), and viscosity parameter, αvisc(r), for different planet masses and locations, for a disc model where the unperturbed viscosity is αvisc,0 = 10−3. We see that planets, at an identical mass, tend to carve a deeper gap when they are closer to the star. We also tested the empirical gap profile from Duffell (2020). Over the range of planet mass we explore (Sect. 2.5), the main difference compared to Kanagawa et al. (2017) lies in slight changes to the shape of the gap edge. We nevertheless found no significant differences in the measured dust leakiness relative to Kanagawa et al. (2017) when using the gap profile of Duffell (2020).
across the gap, see Kanagawa et al. 2017; Duffell 2020; Wafflard-Fernandez & Lesur 2023). The local turbulence δturb controlling particle size and diffusion is not affected by the gap profile, hence it is kept constant in our models. In Fig. 2, we show the radial profile of the initial gas surface density, Σg,0(r), and viscosity parameter, αvisc(r), for different planet masses and locations, for a disc model where the unperturbed viscosity is αvisc,0 = 10−3. We see that planets, at an identical mass, tend to carve a deeper gap when they are closer to the star. We also tested the empirical gap profile from Duffell (2020). Over the range of planet mass we explore (Sect. 2.5), the main difference compared to Kanagawa et al. (2017) lies in slight changes to the shape of the gap edge. We nevertheless found no significant differences in the measured dust leakiness relative to Kanagawa et al. (2017) when using the gap profile of Duffell (2020).
A limitation of using a 1D code such as DustPy is that we cannot self-consistently follow the planet position and model the detailed gas flow taking place in its surroundings, for which 2D and 3D hydrodynamic simulations are necessary (Weber et al. 2018; Haugbølle et al. 2019; Petrovic et al. 2024; Van Clepper et al. 2025a; Huang et al. 2025; Nicholson & Bae 2025). Such simulations find that small leaky grains pass the planetary gap on horseshoe orbits, sometimes entering the close vicinity of the planet (Petrovic et al. 2024), which may result in pebble accretion beyond the pebble isolation mass (see Figure 7 in Van Clepper et al. 2025a). We further discuss the advantages and limitations of our approach compared to 2D/3D hydrodynamic simulations in Sect. 4.4.
Apart from the gas profile, we adopt a similar setup to Stammler et al. (2023), in which simulations are initialised by removing any dust grains located inside the planetary gap. Specifically, we set up the initial dust surface density profile by removing dust located inside r ≤ 2 ap. Removing the inner disc dust has several advantages. Firstly, it reduces the computational expense of simulations by several factors, hence allowing the exploration of a larger parameter space. Secondly, it simplifies the interpretation of our results, as any dust grains found inside the planetary gap must originate from the leaking of the dust trap. In Appendix A, we demonstrate that this approach does not affect the analysis of leakiness from our simulations.
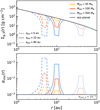 |
Fig. 2 Radial profile of the gas surface density Σg (upper panels) and disc viscosity αvisc (lower panels) including a dust trap caused by a different planet mass and location, whose shape and depth is computed using empirical fits from Kanagawa et al. (2017). We pick here our lowest value of the viscosity (αvisc,0 = 10−3) that produces the deepest gaps in our parameter study. For comparison, Mp = 300 M⊕ corresponds to an approximately Jupiter-mass planet. |
2.4 Planetesimal formation
Dust traps may provide the necessary conditions for the onset of planetesimal formation through the streaming instability (e.g. Eriksson et al. 2020). Planetesimal formation would locally convert a fraction of the dust mass into planetesimals, hence decreasing the mass flux through the planetary gap. To properly model the leakiness of dust traps, it is thus necessary to include planetesimal formation in our model. Aligned with results from streaming instability simulations (Carrera et al. 2015; Li & Youdin 2021; Lim et al. 2024), we trigger the formation of planetesimals in the dust trap if the midplane dust-to-gas ratio is ϵd2g = ρd/ρg ≥ 1. In that case, we follow the prescription of Drążkowska et al. (2016) and Schoonenberg et al. (2018), and convert a fraction of the dust mass into planetesimals as
![Mathematical equation: $\[\frac{\partial \Sigma_{\text {pla }}}{\partial t}=\zeta \Omega_{\mathrm{K}} \sum_{i} \Sigma_{\mathrm{d}, i} \mathrm{St}_{i},\]$](/articles/aa/full_html/2026/06/aa59705-26/aa59705-26-eq2.png) (1)
(1)
where each particle size i contributes inversely to its settling timescale tset,i = (StiΩK)−1. We set the planetesimal formation efficiency4 per settling timescale to ζ = 10−3, similarly to previous works (e.g. Andama et al. 2024; Lau et al. 2024; Zhao et al. 2025).
2.5 Parameter space exploration
Our aim is to provide a global overview of the impact of dust traps and their leakiness on the composition of the inner disc. Many parameters may influence the leakiness of traps, notably those influencing the size distribution, transport and collisional evolution of dust grains.
We chose to focus on a set of four fundamental parameters (see Sects. 2.2 and 2.3): (1) the disc viscosity αvisc which determines the inwards motion of gas and small grains along with the gap depth, (2) the local turbulence δturb that controls the dust particle size and the radial and vertical diffusion, (3) the planet mass Mp, and (4) the planet location ap, both of which impact the gap profile (width and depth). To be consistent with the mass accretion rate observed in discs (e.g. Hartmann et al. 2016; Rafikov 2017; Manara et al. 2020), we choose five values for αvisc ∈ [10−3, 10−2].
Estimating the local turbulence in the protoplanetary disc is more complex. Considering that laboratory experiments favour fragile grains (see Sect. 2.1), weak local turbulence δturb ≈ 10−4 is required to explain the dust particle size measured in discs with ALMA (Jiang et al. 2024; Tong et al. 2026; Luo et al. 2026). The analysis of the dust settling in a sample of 33 protoplanetary discs by Villenave et al. (2025), along with the gas emission turbulent broadening (Flaherty et al. 2017; Teague et al. 2018), also argue in favour of weak turbulence. Meanwhile, the width of ALMA rings in the DSHARP survey (Dullemond et al. 2018; Rosotti et al. 2020) provides hints of efficient radial and vertical diffusion, with a turbulence level as high as δturb ≳ 10−3. However, if these rings have a planetary origin, the dust trap may host stronger turbulence due to the planet stirring material close to the gap edge (Binkert et al. 2023). In this case, turbulence levels inferred from ALMA rings may not be representative of the global value of δturb in the protoplanetary disc. Overall, we pick five values across a larger range δturb ∈ [10−4, 10−2]. For each pair (αvisc, δturb), we test different planet masses Mp = [30, 100, 300] M⊕ and locations ap = [5, 10, 40] au (along with simulations without any planet). Taken together, our parameter scan represents over 300 simulations.
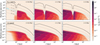 |
Fig. 3 Vertically-integrated dust density distribution as a function of particle size for a disc with a gap carved by a 100 M⊕ planet at 10 au (upper panels) compared to a smooth disc (lower panels). In the model shown here, the disc viscosity is set to αvisc = 10−3 and the local turbulence to δturb = 3.2 × 10⁻⁴. The colour bar indicates the surface density of dust in a given size range at a given radius. The three panels represent different times of the simulation (t = 0.2 Myr, t = 1 Myr, and t = 5 Myr). The black contours show different values of the Stokes number (St = [10−3, 10−2, 10−1, 100]) for visual guidance. |
3 Results
3.1 The impact of dust traps
In this section, we focus on a single, representative simulation to illustrate in greater details the impact of a local pressure maximum on dust evolution and how a dust trap can be more or less leaky. We focus on the model of a disc with a 100 M⊕ planet that has carved a gap at 10 au, with a viscosity αvisc = 10−3 and local turbulence δturb = 3.2 × 10⁻⁴. The fragmentation velocity is set to the nominal value vfrag = 1 m s−1 (Sect. 2.1).
3.1.1 Dust distribution and velocities
We begin by presenting in Fig. 3 the evolution of the dust density distribution at different times (0.2 Myr, 1 Myr, 5 Myr) for the planet-hosting disc (upper panels) as compared to a smooth disc (lower panels). As explained in Sect. 2.3, our initial conditions impose that no solid material is located inside the gap at the onset of the simulation. Fragile grains (vfrag = 1 m s−1) coupled with weak local turbulence (δturb = 3.2 × 10⁻⁴) results in pebbles growing up to ≈ 1 mm around the planet location before being halted by fragmentation (blue line). This corresponds, in the dust trap outside of the planetary gap, to a Stokes number of Stfrag ≈ 10−2. By t ≲ 0.2 Myr, outer disc solids have already passed through the gap on their way to the inner disc, though more slowly than in a smooth disc. The lower left panel offers a visual on how the leakiness of dust traps works. Though millimetre-sized pebbles are blocked in the local pressure maximum, small grains are well coupled to the gas and move through the gap, before re-coagulating on the other side. Even though small grains make up only a minor fraction (here ≈20%) of the solid mass budget in the fragmentation-limited equilibrium, their constant replenishment by the fragmentation of pebbles gradually allows the mass stored in pebbles to leak through. After 1 Myr, the inner disc is filled with outer disc material. The dust distribution appears similar to that of a smooth disc. After 5 Myr, a substantial accumulation of dust is still present at the gap edge, which may promote planetesimal formation.
We then present in Fig. 4 the dust velocity5 as a function of Stokes number for the planet-hosting disc (upper panel) as compared to a smooth disc (lower panel). The dust velocity is computed following
![Mathematical equation: $\[v_{\mathrm{r}, \text {dust}}=\left[v_{\text {gas}}-2 \eta v_{\mathrm{K}} \mathrm{St}\right] \frac{1}{1+\mathrm{St}^{2}}\]$](/articles/aa/full_html/2026/06/aa59705-26/aa59705-26-eq3.png) (2)
(2)
such that it depends on the gas velocity vgas and a dust drift component proportional to the Stokes number and the midplane pressure gradient η ∝ – ∂ ln P/∂ ln r. For a smooth disc, dust grains move inwards for all Stokes numbers (lower panel in Fig. 4). The inwards velocity is dominated by the gas speed for small grains and by the drift component for larger dust particles. In a planet-hosting disc, a local pressure maximum is present right outside the gap. As a result, large particles no longer drift inwards but rather move outwards towards the pressure maximum (blue region). For a 100 M⊕ planet that has carved a gap at 10 au, we find the critical Stokes number separating what is blocked from what leaks to be Stcrit ≈ 5 × 10⁻⁴, corresponding to grains with a radius of 10 μm at the gap edge (see dashed contour). As fragmentation halts the growth of pebbles around Stfrag ≈ 10−2, most pebbles accumulate in the local pressure maximum in the blue region. However, as seen in Fig. 3, fragmentation gradually transfers mass from blocked pebbles (blue region, St > Stcrit) to small grains (red region, St < Stcrit), allowing a significant reservoir to leak.
When approaching the gap, the gas density decreases such that grains with a constant size have higher Stokes number (see dark contours). For a 100 M⊕ planet at 10 au, the Stokes number increases in the planetary gap by an order of magnitude. As noted in Weber et al. (2018), this restrains the size range of leaky grains as the increasing Stokes number close to the gap gives a higher outwards velocity component to dust particles. Without that effect, particles approaching 100 μm could leak as well. This highlights that assuming a constant Stokes number to model the leakiness of dust traps can be inconsistent with the dust aerodynamics. Nevertheless, considering the mass exchange between pebbles and small grains with our full grain size distribution model, we see that this increase in Stokes number is not sufficient to prevent material from leaking (as is evident from Fig. 3).
Once in the gap, the radial velocity is directed inwards across all Stokes numbers; hence, grains can no longer be halted on their way to the inner disc6. It is also interesting to see that in the gap, Stfrag > Stcrit. This means that even though the smallest grains can leak, they are able to re-coagulate inside the gap, and settle in a new fragmentation-limited equilibrium7 (also seen in Fig. 3), which corresponds to the same Stokes number Stfrag as in the trap, though the actual particle size is lower. Overall, we can see that the gap is a highly dynamic environment for dust particles. Leaky grains do not simply move inwards at a constant size, but fragment and re-coagulate continuously throughout their journey.
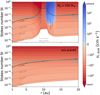 |
Fig. 4 Dust velocity as a function of distance from the star and dust Stokes number in a disc hosting a 100 M⊕ planet that has carved a gap at 10 au (upper panel) compared to a smooth disc (lower panel) for a global viscosity αvisc = 10−3 and local turbulence δturb = 3.2 × 10⁻⁴. Negative velocity represents the inwards motion of dust grains (red) while a positive velocity shows the outwards motion (blue). The dark contours represent the variations in Stokes number for fixed particle size (from 1 μm to 1 mm). The Stokes number decreases monotonously in the smooth disc when approaching the star. In planet-hosting discs, low gas density in the planetary gap increases the Stokes number locally. |
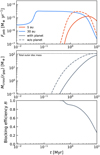 |
Fig. 5 Key diagnostic quantities to quantify the leakiness of dust traps, here for the fiducial model of a disc with a 100 M⊕ planet that has carved a gap at 10 au for a global viscosity αvisc = 10−3 and local turbulence δturb = 3.2 × 10⁻⁴. Upper panel: pebble flux Fpeb outside the planetary gap (30 au, blue) and reaching the inner disc at 1 au (red), for a planet-hosting disc (solid line) or smooth disc (dashed line). Middle panel: total solid mass Mcross that has crossed the radial location rgap = 10 au since t0 as a function of time for a planet-hosting disc (solid line) and smooth disc (dashed line). The horizontal dotted line indicates the total solid mass initially located outside of 10 au. Lower panel: Trap blocking efficiency ℬ of the dust trap since t0 as a function of time (see Eq. (4)). |
3.1.2 Dust transport to the inner disc
To better quantify the impact of a gap on the material received by the inner disc, we show a few diagnostic quantities in Fig. 5, notably the pebble flux Fpeb (upper panel) and the total mass of dust that has crossed the planetary gap, Mcross(rgap) (middle panel). The latter is equivalent to the cumulative pebble flux since t0 through the planetary gap location, rgap, as
![Mathematical equation: $\[M_{\text {cross}}(t, r_{\text {gap}})=\int_{t_{0}}^{t} F_{\text {peb}}\left(t^{\prime}, r_{\text {gap}}\right) \mathrm{dt}^{\prime}.\]$](/articles/aa/full_html/2026/06/aa59705-26/aa59705-26-eq4.png) (3)
(3)
In the upper panel of Fig. 5, we see that the pebble flux is identical outside the planetary gap, but quite different in the inner disc. Initially, the pebble flux reaching the inner part of the smooth disc is greater, peaking at Fpeb = 3 × 10⁻⁵ M⊕ yr−1 before decaying around 5 Myr as the pebble reservoir empties out. In the case of a planet-hosting disc, the pebble flux is smaller, though it still reaches values Fpeb ≈ 10−5 M⊕ yr−1. This causes the pebble flux to be longer-lived, such that after 5 Myr the inner disc of the planet-hosting disc receives more solid material than the smooth disc (see also Stammler et al. 2023). In the middle panel in Fig. 5, we see that the total mass that has crossed the planetary gap (i.e. the cumulative flux over rgap = 10 au) is lower in a planet-hosting disc, but it becomes closer to the smooth disc with time. By 5 Myr, 75% of the total solid mass initially located outside the planetary gap has crossed towards the inner disc.
We introduce now a new quantity that we use in this paper to make meaningful comparisons between the trapping efficiency of different dust traps: the trap blocking efficiency ℬ. The trap blocking efficiency quantifies the ability of a given dust trap to block the pebble flux over time, and is defined as
![Mathematical equation: $\[\mathcal{B}(t)=1-\frac{M_{\text {cross}}^{\text {gap}}(t, r_{\text {gap}})}{M_{\text {cross}}^{\text {no gap}}(t, r_{\text {gap}})}\]$](/articles/aa/full_html/2026/06/aa59705-26/aa59705-26-eq5.png) (4)
(4)
where ![Mathematical equation: $\[M_{\text {cross}}^{\text {gap}}\]$](/articles/aa/full_html/2026/06/aa59705-26/aa59705-26-eq6.png) and
and ![Mathematical equation: $\[M_{\text {cross}}^{\text {no gap}}\]$](/articles/aa/full_html/2026/06/aa59705-26/aa59705-26-eq7.png) represent the total solid mass that has crossed r = rgap since t0 for a simulation with or without adding the planet-induced pressure perturbation in the disc profile (see middle panel in Fig. 5). With that definition, a blocking efficiency ℬ = 0.75 means that the dust trap has blocked 75% of the solid material since the beginning of the disc lifetime compared to what drifted inwards in a smooth disc. On the contrary, a blocking efficiency ℬ = 0 at a given time t means that by that time, a similar amount of dust made it to the inner disc compared to a smooth disc. By comparing each simulation to an identical control simulation performed without a planetary gap, we ensure that the blocking efficiency parameter ℬ only quantifies the change in pebble flux that arises from the presence and leakiness of the gap. In contrast, varying parameters such as δturb also alters the global dust dynamics in the disc – for example by modifying the particle size and inwards drift motion and, hence, the pebble flux – even in a smooth disc. The comparison with the gap-free control simulation removes these global effects and ensures that the blocking efficiency parameter ℬ only quantifies the contribution of the gap8. With this definition of ℬ, we can also define a complementary parameter, namely the leaking efficiency ℒ = 1 – ℬ.
represent the total solid mass that has crossed r = rgap since t0 for a simulation with or without adding the planet-induced pressure perturbation in the disc profile (see middle panel in Fig. 5). With that definition, a blocking efficiency ℬ = 0.75 means that the dust trap has blocked 75% of the solid material since the beginning of the disc lifetime compared to what drifted inwards in a smooth disc. On the contrary, a blocking efficiency ℬ = 0 at a given time t means that by that time, a similar amount of dust made it to the inner disc compared to a smooth disc. By comparing each simulation to an identical control simulation performed without a planetary gap, we ensure that the blocking efficiency parameter ℬ only quantifies the change in pebble flux that arises from the presence and leakiness of the gap. In contrast, varying parameters such as δturb also alters the global dust dynamics in the disc – for example by modifying the particle size and inwards drift motion and, hence, the pebble flux – even in a smooth disc. The comparison with the gap-free control simulation removes these global effects and ensures that the blocking efficiency parameter ℬ only quantifies the contribution of the gap8. With this definition of ℬ, we can also define a complementary parameter, namely the leaking efficiency ℒ = 1 – ℬ.
The lower panel in Fig. 5 shows the evolution of the gap blocking efficiency versus time. We can see that it quickly decreases with time, indicating that even if slowed, the planet-hosting disc is catching up on the amount of solid mass delivered to the inner disc. By the end of the simulation, the blocking efficiency is around ℬ ≈ 0.25, indicating that 25% of the total drifting dust material ended up blocked by the planetary gap. In this paper, we compare dust traps focusing on their blocking efficiency after 5 Myr, as this represents typically disc lifetimes (e.g. Haisch et al. 2001).
In the end, we can see that even though large pebbles, which dominate the solid mass reservoir in the disc, are blocked in the dust trap due to outwards velocities (see Fig. 4), the gradual transfer of mass from pebbles to grains by fragmentation allows material to leak through the dust trap (Fig. 3). In the disc model explored in this section, this leaking is sufficient to allow 75% of the outer disc mass to make it through the planetary gap during the disc lifetime (Fig. 5).
3.2 Parameter space exploration
We now present our full parameter space exploration in Fig. 6, representing the blocking efficiency, ℬ, of the dust trap by t = 5 Myr for each simulation. As discussed in Sect. 2.5, we perform for each planet mass and location a total of 25 simulations, representing pairs of disc viscosity, αvisc, and local turbulence, δturb. As the blocking efficiency is obtained by comparing with an identical simulation without a gap, each panel is built from 50 DustPy simulations. As mentioned in Sect. 2.1, the fragmentation velocity of grains is set to vfrag = 1 m s−1, but we also explore more resistant grains (vfrag = 3 m s−1) in Sect. 3.2.3.
3.2.1 Trap blocking efficiency versus planet mass
We begin by analysing the impact of the planet mass (hence gap depth) on the blocking efficiency of dust traps. First, we focus on the central panel in Fig. 6, showing the blocking efficiency of a trap carved by a 100 M⊕ planet at 10 au for pairs of viscosity αvisc and local turbulence δturb. We see that the majority of simulations have a blocking efficiency ℬ ≈ 0, demonstrating that over a 5 Myr period, the inner disc has received a similar amount of solid material from the outer disc as compared to a smooth disc. We refer to such dust traps as ‘fully permeable’. Typically, high viscosity αvisc ≥ 5 × 10⁻³ results in fully permeable dust traps, and highly permeable from αvisc ≥ 3 × 10⁻³. This is because the depth of planetary gaps decreases for higher viscosity (Kanagawa et al. 2017), increasing the size range of particles able to cross. Moreover, higher viscosity results in a stronger inwards advection of the gas, making it more challenging for dust particles to be trapped (i.e. to have an outwards velocity towards the pressure maximum, see Eq. (2) and Fig. 4). As the viscosity decreases, the gap depth increases, which restrains the size of dust grains able to leak, and increases ℬ. Still, it is not sufficient to fully stop small grains from moving inwards with the gas. As we have seen in Sect. 3.1, fragmentation gradually transfers the mass from blocked pebbles to leaky grains, resulting in ℬ < 1 in all cases.
Similarly to the viscosity, stronger local turbulence makes leakier dust traps. This is due to the combination of two effects. First, strong turbulence limits the maximum size of pebbles, as in the fragmentation-limited regime we have ![Mathematical equation: $\[a_{\text {max}} \propto \delta_{\text {turb}}^{-1}\]$](/articles/aa/full_html/2026/06/aa59705-26/aa59705-26-eq8.png) . Therefore, stronger local turbulence results in pebbles with smaller sizes and Stokes numbers (see x-axis in Fig. 6), which are more coupled to the inwards gas flow. Second, local turbulence controls the diffusion of dust particles, which fights against the pile-up of dust in the trap. Even at low viscosity, strong local turbulence (lower right corner of the panel) leads to strong leakiness of the dust trap. In the opposite limit, the most efficient blocking occurs for discs with low viscosity and weak local turbulence (lower left corner of the panel) in which case ℬ = 0.97 by 5 Myr. In that case, more than an order of magnitude of outer disc solids remain trapped, as compared to a smooth disc.
. Therefore, stronger local turbulence results in pebbles with smaller sizes and Stokes numbers (see x-axis in Fig. 6), which are more coupled to the inwards gas flow. Second, local turbulence controls the diffusion of dust particles, which fights against the pile-up of dust in the trap. Even at low viscosity, strong local turbulence (lower right corner of the panel) leads to strong leakiness of the dust trap. In the opposite limit, the most efficient blocking occurs for discs with low viscosity and weak local turbulence (lower left corner of the panel) in which case ℬ = 0.97 by 5 Myr. In that case, more than an order of magnitude of outer disc solids remain trapped, as compared to a smooth disc.
We can now discuss how the blocking efficiency evolves for varying planet mass, comparing panels in different columns in Fig. 6. For a lower planet mass (30 M⊕, left panels), the blocking efficiency decreases for all values of viscosity and local turbulence. Effectively, only the lowest pair of viscosity and turbulence slows down dust transport, though it is limited to a few factors as compared to a smooth disc. For a more massive planet (300 M⊕, right panels) comparable to Jupiter, the blocking efficiency increases and a larger fraction of dust traps in our parameter space begin to slow down the transport of pebbles. In the upper right corner, we can also see the appearance of a particular regime where ℬ < 0, which we call ‘super-leaky’. In that case, not only is the gap fully permeable, but it also gives an inwards kick to all particles. This is because in the gap centre, the inwards gas velocity is higher (see Fig. 4), which transports particles faster across the gap. Acting as a highway for the dust population, it gives a stronger pebble flux in the planet-hosting disc as compared to a smooth disc.
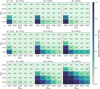 |
Fig. 6 Trap blocking efficiency ℬ (Eq. (4)) of a dust trap by t = 5 Myr for a range of planet mass Mp (30, 100, 300 M⊕) and location ap (5, 10, 40 au). The fragmentation velocity is set to vfrag = 1 m s−1 (Sect. 2.1). For each case, we run simulations for 25 pairs of viscosity αvisc and local turbulence δturb. In total, 300 simulations were used to build this figure. As discussed in Sect. 3.1, a blocking efficiency close to zero indicates a highly permeable dust trap, while a blocking efficiency approaching unity corresponds to a highly blocking trap. We indicate an estimate of the Stokes number of fragmentation-limited pebbles ( |
![Mathematical equation: $\[\mathrm{St}_{\text {frag}}=v_{\text {frag}}^{2} / 3 \delta_{\text {turb}} c_{\mathrm{s}}^{2}\]$](/articles/aa/full_html/2026/06/aa59705-26/aa59705-26-eq9.png)
3.2.2 Trap blocking efficiency versus gap location
We now focus on the impact of the planet location on the dust trap blocking efficiency, comparing panels in different rows in Fig. 6.
When varying the planet location, two effects compete in shaping the blocking efficiency of the dust trap. On the one hand, for an identical planet mass, the gap is deeper closer to the star, and weaker further out (see Fig. 2). On the other hand, the properties of dust particles change with distance from the star. For a given particle size, the Stokes number is lower in the inner disc because of the higher gas density, such that it is more challenging to trap grains there (Fig. 4). These two effects result in opposite trends of how the blocking efficiency of the trap varies according to the planet location.
For a massive planet (Mp ≥ 100 M⊕), the second process dominates. Even though the planet carves a weaker gap in the outer disc, dust grains have higher Stokes numbers and hence are easier to trap. In fact, the most blocking dust trap found in our parameter study (ℬ = 0.9994 by 5 Myr) is in the case of a Jupiter-mass planet at 40 au, for the lowest viscosity and turbulence, in which case only the smallest grains close to monomer size are leaking (see also Pinilla et al. 2024). Meanwhile, the blocking efficiency of a dust trap at 5 au is much lower, with almost all dust traps in our parameter study being highly permeable. It is also interesting to note that at 5 au, the 100 M⊕ planet appears slightly more blocking than the 300 M⊕ planet. As described in Sect. 3.2.1, this is because more massive planets carve deeper gaps, which also gives a stronger inwards velocity to leaky grains (super-leaky regime). In fact, in the upper right panel (300 M⊕ at 5 au), low αvisc = 10−3 but strong δturb = 10−2 result in a deep gap with small particle size, overall leading to a super-leaky trap with ℬ = −0.18 (the most super-leaky trap in our parameter study).
For low-mass planets (Mp = 30 M⊕), the first process dominates and the trend is the opposite. The gap is so weak in the outer disc (Fig. 2) that its presence barely influences dust transport. Overall, at 40 au (lower left panel) the dust trap is fully permeable for all values of viscosity and local turbulence.
To summarise, inner dust traps are rather leaky, while outer disc traps can either be much leakier or more blocking depending on the planet mass. In some cases, solid mass flows inwards more efficiently in planet-hosting discs compared to smooth discs. For planets at ap ≤ 10 au and up to a Jupiter-mass, protoplanetary discs with αvisc ≥ 3 × 10⁻³ and/or δturb ≥ 10−3 transport a similar amount of mass to the inner disc as compared to a smooth disc, over 5 Myr. The most extreme blocking occurs for low viscosity, weak local turbulence, and Mp ≥ 100 M⊕, reaching ℬ > 0.95. As we will see in Sect. 3.3, this is also related to planetesimal forming efficiently at weak local turbulence. In the parameter space we explore, complete blocking (ℬ = 1) is never achieved. We discuss what it takes to reach this regime in Sect. 4.1.
3.2.3 Trap blocking efficiency for resistant grains: vfrag = 3 m s−1
In Fig. 7, we present the blocking efficiency of dust traps by 5 Myr for the case of more resistant dust particles (vfrag = 3 m s−1) for a trap caused by a 100 M⊕ planet at 10 au. In the fragmentation-limited equilibrium, this corresponds to an increase in pebble size and Stokes number of approximately an order of magnitude, as shown on the x-axis (![Mathematical equation: $\[a_{\text {max}} \propto v_{\text {frag}}^{2}\]$](/articles/aa/full_html/2026/06/aa59705-26/aa59705-26-eq10.png) Birnstiel et al. 2011).
Birnstiel et al. 2011).
Compared to fragile grains (vfrag = 1 m s−1, middle panel in Fig. 6) the blocking efficiency is much higher, especially for the lower turbulence range (δturb < 10−3). As we will discuss in Sect. 3.3, this is because a larger fragmentation velocity results in more trapping and a more vertically settled midplane, triggering planetesimal formation in a greater number of dust traps. Note, however, that larger fragmentation velocity coupled with weak turbulence results in very large pebbles (Stfrag ≈ 0.1 in the trap, corresponding to a few centimetres in size), which is not in agreement with observations (Jiang et al. 2024; Tong et al. 2026; Luo et al. 2026).
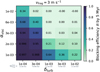 |
Fig. 7 Trap blocking efficiency of a dust trap carved by a 100 M⊕ planet at 10 au by t = 5 Myr for resistant dust grains (vfrag = 3 m s−1), for a range of viscosity αvisc and local turbulence δturb. We indicate an estimate of the Stokes number of fragmentation-limited pebbles ( |
![Mathematical equation: $\[\mathrm{St}_{\text {frag}}=v_{\text {frag}}^{2} / 3 \delta_{\text {turb}} c_{\mathrm{s}}^{2}\]$](/articles/aa/full_html/2026/06/aa59705-26/aa59705-26-eq11.png)
3.3 Forming planetesimals in dust traps
As mentioned in Sect. 2.4, we include the formation of planetesimals in our simulations, provided that the accumulation of dust in the trap is sufficient to raise the dust-to-gas ratio above unity. Thanks to our broad parameter study, we have access to a large sample of dust trap strengths and shapes, allowing us to determine which are strong enough to satisfy these conditions. In Fig. 8, we present the total mass of planetesimals formed by the end of the simulation (10 Myr) for different planet masses at 10 au over a range of viscosity αvisc and local turbulence δturb.
We see that most traps in our sample do not form planetesimals. This is either due to the dust trap being too leaky, or vertical diffusion prohibiting the concentration of dust in the midplane, both of which limit the dust-to-gas ratio below the critical threshold of ϵd2g,crit ≥ 1 (see Sect. 2.4). For stronger dust traps and weak turbulence, planetesimals form with varying efficiency, from about 10 to 100 M⊕ of planetesimals. As also highlighted in previous works (e.g. Drążkowska & Dullemond 2018; Miller et al. 2021; Zhao et al. 2025), weak local turbulence (δturb ~ 10−4) is highly beneficial to planetesimal formation. This is because it simultaneously increases the trapping of pebbles (increasing their size and lowering radial diffusion) while reducing vertical mixing, boosting the dust density in the midplane. The disc viscosity αvisc also impacts planetesimal formation as it affects the depth of the gap. Even for weak turbulence, strong viscosity αvisc ≥ 5 × 10⁻³ prevents planetesimal formation.
To quantify how much the onset of planetesimal formation reduces the leaking of dust grains through the dust trap, we performed additional simulations turning off planetesimal formation (i.e. setting the formation efficiency ζ = 0, see Eq. (1)). We present this comparison in Fig. 9, which shows the pebble flux reaching 1 au (upper panel) and dust trap blocking efficiency (lower panel) as a function of time, similarly to Fig. 5. We focus on the three simulations that formed planetesimals for a planetary gap carved by a 100 M⊕ planet at 10 au. We see that the pebble flux is lowered when planetesimal formation is included, from a few factors up to two orders of magnitude depending on the amount of planetesimals formed. The blocking efficiency is also much larger when planetesimal formation is included. We note that the pebble flux may be further reduced considering pebble accretion by planetesimals in the dust trap (see Lau et al. 2022, 2024, 2025), although only the largest planetesimals formed by the streaming instability are expected to undergo significant growth by pebble accretion (Lorek & Lambrechts 2026).
This highlights one of the key findings of our work: highly blocking dust traps are so because they satisfy the conditions for planetesimal formation, in which case dust is converted into larger bodies. This is also one of the reasons why higher fragmentation velocity (Fig. 7) results in much more highly blocking dust traps; the higher pebble size leads to a more vertically settled midplane layer, facilitating planetesimal formation. If planetesimal formation did not happen in dust traps, for example because SI is inactive at pressure gradient near zero (Abod et al. 2019; Eriksson et al. 2020), or because planet-induced turbulence stirs solids in the trap (Binkert et al. 2023), highly blocking dust traps with ℬ > 0.9 would be much more challenging to achieve9. Interestingly, the impact of planetesimal formation in reducing the leakiness of dust traps was not identified in previous studies based on simpler dust evolution models (Kalyaan et al. 2023). As we will discuss further in Sect. 4.2, our parameter study then finds that it is planetesimal formation rather than the dust trap itself that can dramatically alter the inner disc composition (e.g. oxygen depletion).
 |
Fig. 8 Mass of planetesimals formed in the dust trap generated by a planet at 10 au by the end of our simulations for a range of viscosity αvisc, local turbulence δturb and planet mass Mp. We see that under specific conditions, dust traps can be strong enough to form planetesimals. In that case, a large fraction of the available outer disc dust mass (see Fig. 5) may be transferred into planetesimals. |
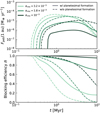 |
Fig. 9 Pebble flux at 1 au and dust trap blocking efficiency ℬ as a function of time for simulations with or without planetesimal formation. We focus on the case of a gap carved by a 100 M⊕ planet at 10 au, in which case only three simulations reach the requirements for planetesimal formation (δturb = 10−4 and αvisc ∈ [10−3, 3.2 × 10⁻³], see Fig. 8). We see that highly blocking dust traps (ℬ > 0.9) can only be achieved thanks to planetesimal formation. If planetesimals did not form, a dust trap in the same disc conditions would be much leakier. |
3.4 Comparisons with simpler dust evolution models
As DustPy does not directly evolve the abundance of volatile species, other models based on the two-population algorithm (two-pop-py, see Birnstiel et al. 2012) have mainly been used in the literature when investigating the impact of dust transport on inner disc composition (Booth et al. 2017; Booth & Ilee 2019; Mah et al. 2023; Lienert et al. 2024; Houge et al. 2025a,b), including in the presence of dust traps (Kalyaan et al. 2023; Mah et al. 2024; Sellek et al. 2025). However, the two-population algorithm was built to model the evolution of smooth discs (Birnstiel et al. 2012), such that it is not clear how well it performs in modelling the transport of dust in the presence of a dust trap.
To investigate the performance of simpler dust evolution models, in Fig. 10 we compare the blocking efficiency computed by DustPy, ℬDustPy, with that of the two-population algorithm, ℬ2pop (incorporated within chemcomp, Schneider & Bitsch 2021), in the presence of a 100 M⊕ at 10 au, for fragile (upper panel) and resistant dust grains (lower panel). The difference Δℬ between ℬDustPy and ℬ2pop is computed as
![Mathematical equation: $\[\Delta ~\log _{10}(\mathcal{B})=\log _{10}\left(\frac{1-\mathcal{B}_{\text {DustPy}}}{1-\mathcal{B}_{2 \text {pop}}}\right),\]$](/articles/aa/full_html/2026/06/aa59705-26/aa59705-26-eq12.png) (5)
(5)
such that Δ log10(ℬ) = 0 means that both models agree, while larger positive or negative values indicate orders of magnitude differences.
For strong turbulence (δturb ≳ 10−3), the difference in blocking efficiency is close to zero, indicating that two-pop-py performs relatively well. This is because in these simulations, the dust trap is quite permeable (see Sect. 4.1), resembling the case of a smooth disc for which the two-population algorithm was designed. For lower turbulence (δturb ≲ 10−3), however, we see that two-pop-py consistently underestimates the leaking of dust traps, from a few factors up to three orders of magnitude. The difference is worst when the overestimation of the trapped solid mass by two-pop-py results in planetesimal formation, whereas the corresponding DustPy models remain below the threshold for the onset of the streaming instability. Overall, our parameter study with DustPy shows that dust traps are leakier than previously thought, on a broader parameter space.
These significant differences come from the fact that in two-pop-py, the dust population (small grains and pebbles) drifts at a common mass-weighted average speed ![Mathematical equation: $\[\overline{v_{\mathrm{d}}}\]$](/articles/aa/full_html/2026/06/aa59705-26/aa59705-26-eq13.png) (Birnstiel et al. 2012), which is dictated by the velocity of the largest pebbles. Once pebbles are blocked, two-pop-py mimics the leakiness by allowing mass to be transferred across the gap by diffusion (see also Eq. (11) in Sellek et al. 2025). This transition from drift to diffusion-dominated leaking can result in sharp variations in the pebble flux estimated by two-pop-py (see Appendix B). Moreover, for intermediate to low turbulence, the diffusive flux is small which leads to a significant overestimation of the amount of mass blocked in the dust trap. Meanwhile, DustPy considers a full dust size distribution, including the mass transfer between different size bins through coagulation and fragmentation, and self-consistently computes the dust velocity as a function of particle sizes vd(a). It can thus capture the leakiness and its variation across the parameter space more precisely.
(Birnstiel et al. 2012), which is dictated by the velocity of the largest pebbles. Once pebbles are blocked, two-pop-py mimics the leakiness by allowing mass to be transferred across the gap by diffusion (see also Eq. (11) in Sellek et al. 2025). This transition from drift to diffusion-dominated leaking can result in sharp variations in the pebble flux estimated by two-pop-py (see Appendix B). Moreover, for intermediate to low turbulence, the diffusive flux is small which leads to a significant overestimation of the amount of mass blocked in the dust trap. Meanwhile, DustPy considers a full dust size distribution, including the mass transfer between different size bins through coagulation and fragmentation, and self-consistently computes the dust velocity as a function of particle sizes vd(a). It can thus capture the leakiness and its variation across the parameter space more precisely.
Given that previous models linking the impact of outer disc dust traps on the inner disc composition were based on two-pop-py (Kalyaan et al. 2023; Mah et al. 2024; Sellek et al. 2025), it is possible that they underestimated the leaking flux and, hence, the delivery of materials (e.g. oxygen in the form of water ice) from the cold outer regions. We will return to that point in Sect. 4.2.
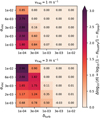 |
Fig. 10 Comparison between the dust trap blocking efficiency found by our full grain size distribution model based on DustPy, ℬDustPy, and the simpler two-population algorithm, ℬ2pop (Birnstiel et al. 2012) here incorporated within chemcomp (Schneider & Bitsch 2021), for identical disc models with fragile grains (upper panel) and resistant grains (lower panel). We see that simpler dust evolution models can overestimate the amount of mass blocked in dust traps by orders of magnitude, hence they may significantly underestimate the flux of outer disc material reaching the inner disc. |
3.5 Pebble flux and volatile delivery to the inner disc
We now present how different dust trap strengths affect the amount of material being delivered to the inner disc, focusing on water ice, and how it relates to observations made with JWST.
Infrared spectra gathered with JWST do not probe the full water reservoir, but a small observable fraction located in the disc’s upper atmosphere (Woitke et al. 2018). More precisely, spectral lines of colder water seem to directly probe the ongoing pebble flux through the water iceline (Banzatti et al. 2023, 2025; Vlasblom et al. 2025). Using the approach of Romero-Mirza et al. (2024), it is possible to analytically estimate the cold water vapour reservoir ![Mathematical equation: $\[M_{\mathrm{H}_{2} \mathrm{O}}^{\text {cold}}\]$](/articles/aa/full_html/2026/06/aa59705-26/aa59705-26-eq14.png) from the pebble flux through the water iceline Fpeb(rice), which is derived from our simulations. The water iceline is defined as the location where T = 150 K and is located at rice = 1.1 au. Following Romero-Mirza et al. (2024) and Krijt et al. (2025), the observed cold water vapour mass is computed as
from the pebble flux through the water iceline Fpeb(rice), which is derived from our simulations. The water iceline is defined as the location where T = 150 K and is located at rice = 1.1 au. Following Romero-Mirza et al. (2024) and Krijt et al. (2025), the observed cold water vapour mass is computed as
![Mathematical equation: $\[M_{\mathrm{H}_{2} \mathrm{O}}^{\text {cold}}(t)=F_{\text {peb}}(r_{\text {ice}}, t) t_{\mathrm{H}_{2} \mathrm{O}} \frac{f_{\mathrm{H}_{2} \mathrm{O}, \text {ice}}}{\eta},\]$](/articles/aa/full_html/2026/06/aa59705-26/aa59705-26-eq15.png) (6)
(6)
where fH2O,ice = 0.2 is the mass fraction of water ice on pebbles (Pätzold et al. 2016), tH2O = 100 yr is the timescale on which newly delivered water vapour is removed by chemistry (e.g. by FUV photodissociation, Vlasblom et al. 2025) or advection, and η is a correction accounting for the fraction of water vapour hidden under the optically thick layer (Houge et al. 2025b; Sellek et al. 2025). Similarly to previous works, we assume a constant value ηobs = 103 (Romero-Mirza et al. 2024; Krijt et al. 2025) but we note that this parameter both varies with time and depends on dust evolution (see Figure 5 in Houge et al. 2025b). We present in Fig. 11 the pebble flux through the water iceline Fpeb(rice) and cold water vapour mass as a function of time for different fragmentation velocities, planet masses, planet locations and initial disc masses. In each panel, we present simulations with varying degrees of trap leakiness, corresponding to weak local turbulence δturb = 10−4 with viscosity ranging from αvisc = 10−3 (most blocking, dark blue) to αvisc = 10−2 (fully permeable, light blue). As seen in Fig. 6, this allows to sample the different leakiness regimes well. We also show the estimates of ![Mathematical equation: $\[M_{\mathrm{H}_{2} \mathrm{O}}^{\text {cold}}\]$](/articles/aa/full_html/2026/06/aa59705-26/aa59705-26-eq16.png) made from JWST observations (see Figure 2 in Krijt et al. 2025). As we focus here on a smaller subset of our parameter study, we ran the simulations for a full disc instead of removing the dust reservoir inside the planetary gap in order to resolve the pebble flux during early stages (see Sect. 2 and Appendix A).
made from JWST observations (see Figure 2 in Krijt et al. 2025). As we focus here on a smaller subset of our parameter study, we ran the simulations for a full disc instead of removing the dust reservoir inside the planetary gap in order to resolve the pebble flux during early stages (see Sect. 2 and Appendix A).
We see that in the early stages, the pebble flux reaching the water iceline is unaffected by the presence of the outer dust trap, as the dust reservoir initially inside the trap drifts inwards as in a smooth disc. It takes some time (tdelay as introduced in Krijt et al. 2025) for the pebble flux to decrease, by an amount sensitive to the blocking efficiency of the dust trap. Only after that time is the composition of the inner disc impacted by the presence of the outer dust trap. We notice that this delay decreases for inner traps, as in this case most of the dust reservoir is initially located outside the gap. Similarly, higher fragmentation velocities result in larger pebbles drifting faster to the inner disc, hence decreasing the delay.
Fully permeable traps (light blue lines) typically reach Fpeb(rice) ≈ 10−4 M⊕ yr−1, which is similar to previous works on smooth discs (e.g. Drążkowska et al. 2021; Williams & Krijt 2025). The pebble flux then decreases by a few factors when increasing the trap blocking efficiency, especially when it becomes sufficient to trigger the formation of planetesimals in the trap (see Sect. 3.3). In the most blocking conditions (αvisc = 10−3, δturb = 10−4), traps carved by a 300 M⊕ planet at 10 au (or a 100 M⊕ planet at 40 au) lead to pebble flux up to two orders of magnitude lower compared to permeable traps (Fpeb(rice) ≈ 10−7–10−6 M⊕ yr−1). In our parameter study, the most efficient reduction of the pebble flux (and hence of the delivery of volatiles) is reached for resistant grains (vfrag = 3 m s−1) along with low viscosity and weak turbulence, together allowing for the formation of pebbles with a Stokes number close to 0.1, and resulting in Fpeb(rice) ≲ 10−7 M⊕ yr−1.
Comparing with the water vapour reservoir observed with JWST, we see that fully permeable dust traps are close to but slightly below the water reservoir measured in smooth discs (![Mathematical equation: $\[M_{\mathrm{H}_{2} \mathrm{O}}^{\text {cold}}\]$](/articles/aa/full_html/2026/06/aa59705-26/aa59705-26-eq17.png) ≈ 1–10 μM⊕). Increasing the initial disc mass (Mdisc = 0.15 M⊙, see lower right panel in Fig. 11) yields a higher pebble flux closer to measurements, though decreasing η (see Eq. (6)) would have a similar effect. We find a good agreement between JWST measurements and our simulations with high to moderate trap leakiness (
≈ 1–10 μM⊕). Increasing the initial disc mass (Mdisc = 0.15 M⊙, see lower right panel in Fig. 11) yields a higher pebble flux closer to measurements, though decreasing η (see Eq. (6)) would have a similar effect. We find a good agreement between JWST measurements and our simulations with high to moderate trap leakiness (![Mathematical equation: $\[M_{\mathrm{H}_{2} \mathrm{O}}^{\text {cold}}\]$](/articles/aa/full_html/2026/06/aa59705-26/aa59705-26-eq18.png) ≈ 0.1–1 μM⊕). However, large uncertainties remain when converting cold water vapour mass in pebble flux, such that it is challenging to draw firm conclusions.
≈ 0.1–1 μM⊕). However, large uncertainties remain when converting cold water vapour mass in pebble flux, such that it is challenging to draw firm conclusions.
Considering CI Tau as a lower limit10 for the cold water vapour mass that can be detected with JWST (![Mathematical equation: $\[M_{\mathrm{H}_{2} \mathrm{O}}^{\text {cold}}\]$](/articles/aa/full_html/2026/06/aa59705-26/aa59705-26-eq19.png) ≈ 10−1 μM⊕), we can compute the amount of dust traps in our parameter grid that have sufficient pebble flux to yield a detectable cold water signal. For η = 103, and focusing on the pebble flux at 1 Myr, the fraction of discs hosting dust traps leaky enough to yield a detectable signal is 67%. This increases to 82% for a lower η = 102, but decreases to only 25% of our sample for η = 104. The fact most traps yield a detectable signal agrees with the fact that most observed discs with JWST hosting deep or shallow dust traps resolved by ALMA display a cold water vapour excess (Banzatti et al. 2023, 2025; Arulanantham et al. 2025; Gasman et al. 2025). This also highlights that the analysis of cold water vapour lines and their variations can be a reliable method with which to quantify the leakiness of dust traps (Krijt et al. 2025), unlike the C/O ratio which we discuss further in Sect. 4.2.2.
≈ 10−1 μM⊕), we can compute the amount of dust traps in our parameter grid that have sufficient pebble flux to yield a detectable cold water signal. For η = 103, and focusing on the pebble flux at 1 Myr, the fraction of discs hosting dust traps leaky enough to yield a detectable signal is 67%. This increases to 82% for a lower η = 102, but decreases to only 25% of our sample for η = 104. The fact most traps yield a detectable signal agrees with the fact that most observed discs with JWST hosting deep or shallow dust traps resolved by ALMA display a cold water vapour excess (Banzatti et al. 2023, 2025; Arulanantham et al. 2025; Gasman et al. 2025). This also highlights that the analysis of cold water vapour lines and their variations can be a reliable method with which to quantify the leakiness of dust traps (Krijt et al. 2025), unlike the C/O ratio which we discuss further in Sect. 4.2.2.
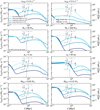 |
Fig. 11 Pebble flux through the iceline (left axis) and observable cold water vapour mass (right axis) versus time for different dust trap leakiness and parameters. The different colours indicate simulations with δturb = 10−4 and varying viscosity from αvisc = 10−3 (most blocking, dark blue) to αvisc = 10−2 (fully permeable, light blue). We present these four cases because as seen in Fig. 6, varying the viscosity across this column samples well the different leakiness regimes. Note that for weak traps (e.g. with Mp = 30 M⊕), even the most blocking trap is quite leaky. Grey dots indicate measurements of the vapour reservoir made with JWST (see Figure 2 in Krijt et al. 2025) and converted into pebble flux following Eq. (6). The title of each panel indicates the parameter that is varied from the standard fiducial values: vfrag = 1 m s−1, Mp = 100 M⊕, ap = 10 au and Mdisc = 0.05 M⊙. The grey star label and horizontal line indicate an estimate of the error on the disc age (~0.5 Myr, Krijt et al. 2025). |
4 Discussion
4.1 The different leaking regimes
4.1.1 Leaking regimes identified in this work
We have seen in this work that the values of some key parameters (αvisc, δturb, Mp and ap) have a significant impact on the leaking of dust traps, giving rise to a variety of leaking regimes impacting the amount of outer disc dust and icy volatiles received by the inner disc. We have identified four regimes which we list and discuss below.
Highly (fully) permeable (ℬ ~ 0–0.2). We identified some dust traps as being highly (fully) permeable. Their blocking efficiency is typically ℬ ~ 0–0.2, indicating that the outer disc material is transported inwards nearly identically to a smooth disc. In this case, dust particles of any size pass through the trap. Dust traps may be highly permeable due to (1) high global viscosity (αvisc ≳ 3 × 10⁻³) weakening the gap depth and giving a stronger inwards velocity component to dust particles; (2) strong local turbulence (δturb ≳ 3 × 10⁻³) boosting diffusion and lowering the maximum particle size; (3) low planet mass (Mp ≲ 100 M⊕) decreasing the local pressure maximum and hence the outwards dust drift component; and (4) the short distance from the star (ap ≲ 5 au) modifying the dust properties.
Super-leaky traps (ℬ < 0). Some highly permeable traps turned out to have negative blocking efficiency ℬ < 0, which we label as being super-leaky. In that case, the full permeability of the dust trap coupled with the much higher gas velocity in the gap centre boosts the inwards transport of solids. This results in a higher delivery of solids in the planet-hosting disc compared to a smooth disc, though not by much, as the blocking efficiency remains close to zero. This regime is favoured when the gap is particularly deep and wide, boosting the inwards velocity by a greater factor over a longer duration. This happens for massive Jupiter-mass planets (Mp ≳ 300 M⊕) and/or planets located closer to the star (ap ≲ 5 au).
Moderately leaky (ℬ ~ 0.2–0.9). These dust traps are strong enough to block the largest pebbles. Even though these particles contain most of the solid mass, their continuous fragmentation into smaller grains allows for a significant fraction of the outer disc mass to leak through the trap. We denote these traps as moderately leaky as they are often called in the literature (e.g. Stammler et al. 2023). Their blocking efficiency ranges from ℬ ~ 0.2–0.9. The inner part of discs with a leaky trap typically receives a smaller pebble flux, reduced by a few factors compared to an equivalent smooth disc (Fpeb(1 au) ≈ 10−5 M⊕ yr−1, Fig. 11). Because the pebble flux is slowed down, it is also longer-lived. Overall, moderately leaky traps will result in a long-lived oxygen-rich inner disc, with a flux of icy pebbles sufficient to result in detectable cold water vapor lines (Banzatti et al. 2025).
Highly blocking (ℬ > 0.9). Some dust traps are strong enough to only allow the smallest grains (close to monomer size) to leak through. In that case, the dust evolution is slowed down significantly, resulting in highly blocking traps with a blocking efficiency ℬ > 0.9 over the disc lifetime (5–10 Myr). Most of the dust remains in the dust trap, and only a small pebble flux reaches the inner disc, which may result in a significant variation of the inner disc composition. Compared with simpler dust evolution models (Sect. 3.4), our parameter study with full dust evolution simulations show that dust traps are leakier than previously thought, such that highly blocking dust traps require specific conditions. Typically, they can be found for the smallest pair of viscosity and turbulence we explored (αvisc = 10−3, δturb = 10−4) and for planet mass Mp ≳ 100 M⊕ or for more resistant grains. Moreover, highly blocking traps are typically made possible due to the efficient formation of planetesimals, sequestrating icy pebbles and hence reducing the mass flux through the trap (see Fig. 8). However, if planetesimal formation is inactive, for example due to planet-induced turbulence (Binkert et al. 2023), these dust traps could fall back on the moderately leaky regime. Interestingly, the role of planetesimal formation in producing highly blocking dust traps was not found in previous works using simpler dust evolution models (Kalyaan et al. 2023); this further highlights the need to use full dust evolution simulations when simulating dust traps.
4.1.2 Can a perfectly blocking dust trap exist?
A regime that we do not identify in our parameter study is the case of a perfectly blocking dust trap, in which case the pebble flux across the trap is zero. Such trap could technically be found if monomers themselves are blocked in the dust trap (Stcrit < Stmon), as was found by Pinilla et al. (2024) when modelling PDS 70 to explain the observation of water vapour in its inner disc (Perotti et al. 2023). However, the size of monomers is not well constrained (though see Tazaki & Dominik 2022; Hensley & Draine 2023). Monomers in reality would also likely have a certain size distribution (Dominik & Tielens 1997; Xiang et al. 2020), or be breakable by collisional fragmentation. It is thus challenging to set clear predictions on the existence of fully blocking traps. We speculate whether deep transition discs for which we do not measure a dusty inner disc (Rota et al. 2024, 2025) may be examples of disc conditions where traps are perfectly blocking.
4.2 Leaky traps and inner disc composition with JWST
4.2.1 Long-lived O-rich inner disc
With its increased sensitivity and spectral resolution, JWST has allowed us to dive deeper than ever into the chemical reservoir of the inner part (~5 au) of protoplanetary discs. As mentioned in Sect. 1, the first years of science with JWST has confirmed early trends seen with Spitzer, namely that the inner disc exhibits a significant compositional diversity. The observed masses of key species (e.g. H2O, CO2, or C2H2) varies by orders of magnitude across observed protoplanetary discs (Arulanantham et al. 2025). Moreover, some molecules are so depleted in some discs that they are not even detected in spectra, such as water in some discs around very low-mass stars (Tabone et al. 2023; Arabhavi et al. 2025). Though several mechanisms have been suggested to explain this diversity, the presence of a dust trap (i.e. local pressure maximum) efficiently blocking icy pebbles prior to sublimation is perhaps the most popular (Tabone et al. 2023; van Dishoeck & the MINDS team 2024; Arabhavi et al. 2026).
Earlier dust transport models designed to study the impact of outer dust traps on the inner disc composition were often based on the two-population algorithm and found that they can have a significant importance (Kalyaan et al. 2023; Mah et al. 2024; Sellek et al. 2025). In fact, Mah et al. (2024) argued that most outer dust traps result in a depletion of oxygen in the inner disc (Regime III, see Figure 1 in Mah et al. 2024), as water (the main carrier of oxygen) remains in the ice mantle of pebbles halted in the trap.
However, as we have discussed in Sect. 3.4, models based on two-pop-py can underestimate the amount of icy pebbles making it through the dust trap by several orders of magnitude. From our parameter study based on a full dust evolution model, we thus find that dust traps are much leakier than previously thought, and this is the case across a broader parameter space. As a result, we argue that the presence of outer disc traps will most likely result in a less intense but longer lived oxygen-rich inner disc, as icy pebbles slowly leak inward. It is still possible for dust traps to be strong enough to deplete the inner disc in oxygen, but that requires specific conditions: the viscosity and turbulence must be weak, and planetesimals have to form efficiently in the trap. However, in that case, it is planetesimal formation rather than the dust trap itself that is capable of significantly altering the inner disc composition (e.g. oxygen depletion).
Our conclusion aligns with the wealth of data that has been gathered by JWST demonstrating that the cold infrared lines of water vapour, whose detection requires an ongoing and non-negligible flux of icy pebbles (Vlasblom et al. 2025), are often detected in discs that host shallow or even deep dust traps (Banzatti et al. 2023, 2025; Arulanantham et al. 2025; Gasman et al. 2025).
4.2.2 Inner disc C/O ratio
Previous works have argued that the presence of an outer dust trap may result in gas-phase C/O > 1 in the inner disc (e.g. Mah et al. 2024). The reason is that if icy pebbles are efficiently trapped in the cold outer region, the delivery of oxygen (in the form of water) to the inner disc is halted. Meanwhile, a fraction of the carbon reservoir is stored in highly volatile components (e.g. CH4) which sublimates into the gas-phase in the far outer regions. As the inwards gas flow is not perturbed by the dust trap, it moves inwards towards the inner disc, resulting in a gas-phase C/O ratio above unity.
However, as our parameter study finds that it is more challenging than previously thought to halt the delivery of oxygenrich icy pebbles to the inner disc, the question is: is the leaking of icy pebbles through the dust trap higher than the flow of carbon-rich gas? Comparing these two quantities can effectively tell us whether dust traps can result in inner disc gas-phase C/O ratio above or below unity. With solar carbon abundances (C/H = 2.69 × 10⁻⁴, see Asplund et al. 2009), and assuming an upper limit that 10% of carbon is stored in highly volatile CH4 molecules capable of elevating the C/O ratio (Mah et al. 2023), we can estimate the flux of C-rich gas11 as ![Mathematical equation: $\[F_{\mathrm{C} -\text {bearing}}=\frac{(\mathrm{C} / \mathrm{H})}{10} F_{\text {gas}}\]$](/articles/aa/full_html/2026/06/aa59705-26/aa59705-26-eq20.png) , where Fgas is the gas flux from our simulations. Meanwhile, the flux of oxygen is FO–bearing = fH2O,iceFpeb, assuming a lower limit for the mass fraction of water ice on pebbles to fH2O,ice = 0.2 (Sect. 3.5).
, where Fgas is the gas flux from our simulations. Meanwhile, the flux of oxygen is FO–bearing = fH2O,iceFpeb, assuming a lower limit for the mass fraction of water ice on pebbles to fH2O,ice = 0.2 (Sect. 3.5).
In Fig. 12, we present the flux of oxygen (in the form of icy pebbles) and carbon (in the form of gas-phase CH4) reaching the iceline (1 au), for our fiducial model of a trap carved by a 100 M⊕ at 10 au (upper left panel in Fig. 11). As before, we focus on models with δturb = 10−4 and varying viscosity αvisc, as these sample the different blocking efficiency regimes well (Fig. 6). We see that even for highly blocking dust trap, the flux of oxygen is orders of magnitude higher than the flux of carbon. Upon checking with our full sample (250 different dust traps), four dust traps12 manage to halt icy pebbles sufficiently for carbon to dominate and increase the gas-phase C/O ratio above unity, which are those where ℬ > 0.99 and planetesimals form efficiently. Similarly to our conclusion in Sect. 4.2.1, it is thus the efficient formation of ice-rich planetesimals more than dust traps themselves that manages to raise the C/O ratio in the inner disc.
As a growing sample of protoplanetary discs observed with JWST, in particular around very low-mass stars, exhibit inner disc gas-phase C/O > 1 (Tabone et al. 2023; Arabhavi et al. 2024; Kanwar et al. 2024; Long et al. 2025; Colmenares et al. 2024), our findings raise a question: if achieving inner disc C/O > 1 through the presence of outer disc dust traps requires them to be highly blocking – along with efficiently forming planetesimals – does this mean that such traps are common in observed discs around very low-mass stars? Instead, other processes may be contributing to the inner disc carbon budget, such as the thermal or chemical processing of carbon stored in refractory species (Houge et al. 2025a), the chemical transformation of highly volatile CO into CH4 (Sellek & van Dishoeck 2025), the presence of inner disc cavities (Mallaney et al. 2026), or the vertical distribution of dust grains (Grant et al. 2025). In that case, we suggest that the cold water vapour emission may be a better observational tracer than the gas-phase C/O ratio to quantify the leakiness of dust traps, though it may require further coupling between dust evolution models and thermochemical models (Vlasblom et al. 2025) to produce spectra directly comparable to observations. This is also supported by the fact that most dust traps in our parameter grid yield a detectable cold water vapour mass, considering CI Tau as a lower limit (Sect. 3.5).
In conclusion, mapping the parameter space of dust traps with full dust evolution models suggests that dust traps are more likely to have a limited impact on the inner disc composition, maintaining a long-lived oxygen-rich inner disc (hence a low inner disc C/O ratio), with some variation in species abundances on a population level that agrees with observations (Banzatti et al. 2023, 2025; Arulanantham et al. 2025; Gasman et al. 2025; Krijt et al. 2025). Still, under the right conditions (low turbulence, low viscosity, efficient planetesimal formation), highly blocking traps can slow down icy pebbles by orders of magnitude and deeply affect the inner disc composition.
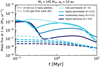 |
Fig. 12 Mass flux of oxygen (stored in water ice, solid lines) and carbon (in gas-phase CH4, dashed lines) at 1 au as a function of time, for a disc with a gap carved by a 100 M⊕ planet at 10 au. As in Fig. 11, we focus on simulations with δturb = 10−4 and varying viscosity, as these sample the different leakiness regimes well. We see that the pebble flux is always above the flux of C-rich gas, meaning that it is challenging for outer dust traps to result in inner disc gas-phase C/O above unity. |
4.2.3 The impact of inner versus outer traps
From Fig. 6, we see that highly blocking dust traps are more easily produced in the outer disc, due to how dust properties change with distance from the star. However, as noted by Kalyaan et al. (2023), even if inner dust traps are leakier, a larger fraction of the total disc reservoir has to go through the trap. Over long timescales, this could compensate for the higher leakiness of inner traps, and make them more effective at controlling the inner disc composition than outer traps. To investigate the long-term effect of inner versus outer traps. We can instead compare the cumulative mass flux Mcross through 1 au (see Eq. (3)) for simulations with traps at 40 au and 5 au. We present their ratio in Fig. 13 for identical disc models, that is assuming both traps are carved by a 100 M⊕ planet in a disc with identical viscosity and turbulence. We show the results of different simulations varying the viscosity leading to varying trap blocking efficiency, as in Fig. 11. We see that the ratio is above unity for t < 1 Myr, indicating that the inner part of discs with outer dust traps receive more material at early times. This is because the pebble flux reaching 1 au takes longer than 1 Myr to decrease because of the effect of a trap at 40 au. For t > 1 Myr, the ratio is below unity, indicating that in the long run, discs with inner traps (r ~ 5 au) deliver more material to the inner disc.
Overall, for traps carved by an identical planet mass, inner dust traps are the most effective at early times (≲1 Myr) in regulating the inner water delivery (Kalyaan et al. 2021, 2023; Easterwood et al. 2024; Krijt et al. 2025), while at later times (≳1 Myr), outer dust traps become the most effective. This behaviour was not identified by Krijt et al. (2025), which we explain by the fact that they assumed a trap blocking efficiency constant with the trap position, while we find inner traps to be leakier (Fig. 6). Further investigating the impact of inner versus outer traps could be an interesting avenue for future works, and especially implementing several traps per disc in DustPy simulations.
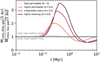 |
Fig. 13 Ratio of the cumulative mass flux (Eq. (3)) reaching 1 au of simulations with outer traps at 40 au relative to simulations with inner traps at 5 au both carved by a 100 M⊕ planet, for different blocking efficiency regime as in Fig. 11. The ratio changes from above to below unity, indicating that in early stages (t < 1 Myr) inner dust traps have a greater impact on the delivery of material to the iceline, while at later stages (t > 1 Myr) their overall higher leakiness makes them less impactful. |
4.3 Planetesimal formation and pebble accretion beyond Miso
Apart from impacting how the disc composition evolves, the leakiness of dust traps has an impact on the onset of planet formation itself. We have seen in Sect. 3.3 that leakiness may prevent the dust trap from reaching the high dust densities required to trigger planetesimal formation. The onset of the streaming instability in the dust trap is thus limited to a subset of the parameter space, associated with weak local turbulence (δturb ≲ 10−4) and a deep gap as reached in our model with low viscosity (αvisc ≲ 3 × 10⁻³) and high planet mass (Mp ≥ 100 M⊕). Naturally, the onset of planetesimal formation in dust traps depends on a more extensive parameter space than the one explored in this work, such as the initial dust-to-gas ratio (e.g. Andama et al. 2024). Still, self-consistently modelling the leaking process is a necessary ingredient to fully explore what may or may not happen in dust traps (Lyra et al. 2009).
Dust traps also impact the later stages of planet formation, namely the growth of planetary embryos through pebble accretion. Pebble accretion is generally assumed to stop once the planetary embryo reaches the pebble isolation mass Miso (e.g. Lambrechts et al. 2014; Ataiee et al. 2018; Bitsch et al. 2018). Beyond that mass, which we estimate in our disc model as Miso ~ 15 M⊕ at 10 au following Johansen & Lambrechts (2017), the protoplanet deeply modifies the local gas profile, and inwardsdrifting pebbles become trapped in the local pressure maximum. However, we have seen in this work that the fragmentation of trapped pebbles leads to a constant replenishment of small grains able to leak (even for Mp > 20 Miso). Depending on the trajectory of small grains once in the planetary gap, a fraction of the leaky flux may thus be accreted by the protoplanet, even beyond Mp > Miso (see also discussion in Drążkowska et al. 2019). Using 3D hydrodynamic simulations with a fixed particle size, Van Clepper et al. (2025a) found that a relatively small fraction of small grains may be accreted by the planet. Considering small grains may re-coagulate in the planetary gap to larger Stokes number (Fig. 3), the accreted fraction may be larger. Concerning the effect on other planets that may form interior to a dust trap, permeable or moderately leaky dust traps would have a limited impact, but they could eventually modify the system architecture, favouring terrestrial planets or super-Earths for low pebble fluxes (Lambrechts et al. 2019; Johansen et al. 2021). On the other hand, highly blocking traps could prevent the growth of inner planets, while simultaneously converting the trapped mass into planetesimals in the outer system. That is, of course, providing that the outer planet forms first, which is not expected from the perspective of faster growth by pebble accretion in the inner disc (Lau et al. 2024; Danti et al. 2025).
4.4 Limitations
In this work, we have performed an extensive parameter space exploration of leaky dust traps over the whole disc evolution (with tend = 10 Myr). Our focus has been on understanding how the specificity of dust coagulation, fragmentation, and transport, can alter the leakiness of traps and hence the delivery of outer disc material to the inner disc. For this we used the state-of-the-art code DustPy, simulating dust evolution with a full grain size distribution over a one-dimensional radial grid. Even though this represents a significant improvement compared to simpler dust evolution models, there are still many processes that cannot be captured accurately by DustPy, notably due to its one-dimensional nature.
When using sophisticated 2D or 3D hydrodynamic simulations, it is possible to self-consistently simulate the gap-opening process (e.g. Kanagawa et al. 2017; Weber et al. 2018, 2019; Haugbølle et al. 2019; Duffell 2020). This gives access to accurate gap depth and shape, along with the gas-flow patterns in and around the planetary gap (Petrovic et al. 2024; Huang et al. 2025; Van Clepper et al. 2025a,b). Though our gap prescription is based on 2D hydrodynamic simulations performed by Kanagawa et al. (2017), some differences may arise depending on the parameter space that is explored (Pfeil et al. 2025). Note, however, that hydrodynamic simulations are restricted to a single particle size or a few non-interacting size bins (i.e. no mass exchange). Their improvements in modelling the gap and gas flow patterns are thus counterbalanced by the fact they cannot capture the coagulation and fragmentation of dust grains well, which, as we saw in this work, is important for the modelling of dust trap leakiness. Moreover, hydrodynamic simulations are limited in their temporal span (tend ≪ 1 Myr), and hence they cannot evolve the transport of dust over the whole disc lifetime. Because leaking slows down dust evolution, simulating dust transport over long timescales, which can be done with DustPy, provides the possibility to perform a long-term analysis of the pebble flux. Overall, using either a full grain size distribution or a multi-dimensional hydrodynamic simulation, both have their advantages and limitations. Although there have been some efforts to combine these two approaches (Drążkowska et al. 2019), there is still work to do to build a new framework including both effects. Nevertheless, the recent release of TriPod (Pfeil et al. 2024; Kaufmann et al. 2025), the upgrade of the two-pop-py algorithm, opens new and exciting doors for a better simple treatment of dust evolution in hydrodynamic simulations (Pfeil et al. 2025).
5 Conclusions
In this work, we performed a large-scale parameter space exploration of dust transport in protoplanetary discs containing a dust trap, assumed to have a planetary origin, with the state-of-the-art dust evolution code DustPy (Stammler & Birnstiel 2022). Our goal was to quantify the leakiness of different dust traps over the disc lifetime and map out in which area of the parameter space different leakiness regimes can be found. We then discussed the impact of our results on the delivery of volatiles to the inner part of discs, and how it may relate to the chemical diversity observed with JWST. Our findings are summarised as follows:
A planet-induced gap results in the establishment of a local pressure maximum outside the gap. The pressure maximum acts as a dust trap in which pebbles, whose motion follows the opposite direction of the pressure gradient, accumulate. Meanwhile, small grains are well coupled to the gas and leak through the dust trap (Fig. 4). Even though small grains make up a minor fraction of the total solid mass, the continuous fragmentation of pebbles gradually transfers mass into leaking grains (Fig. 3). Over time, most of the outer disc solid reservoir may flow through the gap and contaminate the inner disc (Fig. 5). Self-consistently including the mass exchanges between pebbles and grains is a fundamental ingredient in quantifying the leakiness of trap.
We perform a large parameter space exploration, investigating the impact of the disc viscosity αvisc, the disc turbulence δturb, the planet mass Mp and location ap, and the fragmentation velocity vfrag. At a fixed location, the dust trap carved by a Jupiter-mass planet is much less leaky than that of a smaller planet (Fig. 6). Furthermore, dust traps in the inner disc (r ≤ 5 au) are leakier than traps in the outer disc (r ≥ 40 au, see Fig. 6) due to the change in dust properties in the inner versus outer disc (e.g. temperature, Stokes number). Therefore, while at early times (t ≲ 1 Myr) inner traps are the most effective in reducing the pebble flux, outer traps become more important at later times (t ≳ 1 Myr) as they are less leaky (Sect. 4.2.3). More resistant dust grains (vfrag = 3 m s−1) and weak turbulence (δturb ≤ 3 × 10⁻⁴) yield dust traps with significantly greater blocking efficiency (Fig. 7), though the resulting pebble size is larger than what is measured in discs with ALMA (e.g. Jiang et al. 2024; Tong et al. 2026; Luo et al. 2026).
From our parameter study, we find most dust traps to be highly permeable or moderately leaky (Fig. 6), in which case the pebble flux is only reduced by up to a factor of a few and a large fraction of the outer disc reservoir reaches the inner disc over the disc lifetime (5 Myr). As a result, most dust traps will result in a long-lived, oxygen-rich inner disc (Sect. 4.2.1), paired with a gas-phase C/O ratio below unity (Sect. 4.2.2). This provides a possible explanation for the cold water excess commonly detected in discs with JWST, including those hosting shallow or deep traps (Banzatti et al. 2023, 2025; Gasman et al. 2025; Temmink et al. 2025; Krijt et al. 2025). To relate dust evolution models directly to measured cold water excess requires more work (Sect. 3.5), notably on constraining the observable column η or coupling dust simulations with thermochemical models.
We compared our results with that of simpler dust evolution models based on the two-population algorithm (two-pop-py, see Birnstiel et al. 2012), which was used in earlier works to study the impact of outer dust traps on the inner disc composition. We find that simpler dust evolution models may overestimate the amount of dust blocked in the trap sometimes by several orders of magnitude (Sect. 3.4). As a result, we find that dust traps are leakier than previously thought, such that the inner and outer disc reservoirs are well connected over a broader parameter space.
In the right conditions (low viscosity and weak turbulence), highly blocking dust traps reducing the pebble flux by orders of magnitude can be produced (Fig. 6). The reduction in pebble flux is such that highly blocking dust traps are capable of deeply affecting the inner disc composition, and may result in an oxygen-poor inner disc with gas-phase C/O > 1 (Sect. 4.2.2). However, the existence of highly blocking traps typically relies on the efficient formation of planetesimals taking place in the trap. If planetesimals did not form (Fig. 9), or if they undergo ablation over time (Eriksson et al. 2021), the traps would be much leakier. In that case, it means that it is planetesimal formation, rather than dust traps themselves, that are capable of significantly altering the inner disc composition. Moreover, within the parameter space we explore, we do not find any fully blocking dust trap (Sect. 4.1.2).
Depending on the disc viscosity and gap depth, we find some discs with highly permeable traps to have more efficient dust transport than in an equivalent smooth disc. We refer to these traps as super-leaky, and this extreme leakiness can occur because of the higher inwards gas velocity during the crossing of the gap.
In the end, the leakiness of dust traps is not a simple matter of finding the critical size of grains that are experiencing leaking in contrast to filtration, but it requires complex coagulation and fragmentation computation based on a full grain size distribution. 2D and 3D hydrodynamic simulations offer great opportunities to probe complementary aspects of dust trap leakiness (gas-flow patterns, gap-opening process, pebble accretion beyond Miso), but they do not give a complete picture in terms of size distribution and long-term temporal evolution. In the future, it is thus essential to try and bring the strength of both methods together, as pioneered by Drążkowska et al. (2019) and Pinilla et al. (2024). In that matter, new dust evolution models developed for implementation into hydrodynamical codes, such as TriPoD, offer promising avenues (Pfeil et al. 2025), though such approaches are yet to be tested (see Eriksson et al. 2026).
Acknowledgements
We are grateful to the anonymous reviewer for their constructive comments. A.H. thanks Sebastiaan Krijt, Joe Williams, Till Kaeufer and Claudia Danti for insightful discussions. A.H. and A.J. acknowledge funding from the Carlsberg Foundation (Semper Ardens: Advance grant FIRSTATMO).
References
- Abod, C. P., Simon, J. B., Li, R., et al. 2019, ApJ, 883, 192 [Google Scholar]
- Alibert, Y., Venturini, J., Helled, R., et al. 2018, Nat. Astron., 2, 873 [NASA ADS] [CrossRef] [Google Scholar]
- Andama, G., Mah, J., & Bitsch, B. 2024, A&A, 683, A118 [NASA ADS] [CrossRef] [EDP Sciences] [Google Scholar]
- Andrews, S. M., Huang, J., Pérez, L. M., et al. 2018, ApJ, 869, L41 [NASA ADS] [CrossRef] [Google Scholar]
- Arabhavi, A. M., Kamp, I., Henning, T., et al. 2024, Science, 384, 1086 [NASA ADS] [CrossRef] [Google Scholar]
- Arabhavi, A. M., Kamp, I., Henning, T., et al. 2025, A&A, 699, A194 [NASA ADS] [CrossRef] [EDP Sciences] [Google Scholar]
- Arabhavi, A. M., Kamp, I., van Dishoeck, E. F., et al. 2026, A&A, 708, A82 [NASA ADS] [CrossRef] [EDP Sciences] [Google Scholar]
- Arulanantham, N., Salyk, C., Pontoppidan, K., et al. 2025, AJ, 170, 67 [Google Scholar]
- Asplund, M., Grevesse, N., Sauval, A. J., & Scott, P. 2009, ARA&A, 47, 481 [CrossRef] [Google Scholar]
- Ataiee, S., Baruteau, C., Alibert, Y., & Benz, W. 2018, A&A, 615, A110 [NASA ADS] [CrossRef] [EDP Sciences] [Google Scholar]
- Banzatti, A., Pontoppidan, K. M., Salyk, C., et al. 2017, ApJ, 834, 152 [NASA ADS] [CrossRef] [Google Scholar]
- Banzatti, A., Pascucci, I., Bosman, A. D., et al. 2020, ApJ, 903, 124 [NASA ADS] [CrossRef] [Google Scholar]
- Banzatti, A., Pontoppidan, K. M., Carr, J. S., et al. 2023, ApJ, 957, L22 [NASA ADS] [CrossRef] [Google Scholar]
- Banzatti, A., Salyk, C., Pontoppidan, K. M., et al. 2025, AJ, 169, 165 [Google Scholar]
- Benisty, M., Tatulli, E., Ménard, F., & Swain, M. R. 2010, A&A, 511, A75 [NASA ADS] [CrossRef] [EDP Sciences] [Google Scholar]
- Binkert, F., Szulágyi, J., & Birnstiel, T. 2023, MNRAS, 523, 55 [NASA ADS] [CrossRef] [Google Scholar]
- Birnstiel, T., Ormel, C., & Dullemond, C. 2011, A&A, 525, A11 [NASA ADS] [CrossRef] [EDP Sciences] [Google Scholar]
- Birnstiel, T., Klahr, H., & Ercolano, B. 2012, A&A, 539, A148 [NASA ADS] [CrossRef] [EDP Sciences] [Google Scholar]
- Bitsch, B., Morbidelli, A., Johansen, A., et al. 2018, A&A, 612, A30 [NASA ADS] [CrossRef] [EDP Sciences] [Google Scholar]
- Booth, R. A., & Ilee, J. D. 2019, MNRAS, 487, 3998 [CrossRef] [Google Scholar]
- Booth, R. A., Clarke, C. J., Madhusudhan, N., & Ilee, J. D. 2017, MNRAS, 469, 3994 [Google Scholar]
- Carr, J. S., & Najita, J. R. 2008, Science, 319, 1504 [Google Scholar]
- Carrera, D., Johansen, A., & Davies, M. B. 2015, A&A, 579, A43 [NASA ADS] [CrossRef] [EDP Sciences] [Google Scholar]
- Ciesla, F. J., & Cuzzi, J. N. 2006, Icarus, 181, 178 [NASA ADS] [CrossRef] [Google Scholar]
- Colmenares, M. J., Bergin, E. A., Salyk, C., et al. 2024, ApJ, 977, 173 [NASA ADS] [CrossRef] [Google Scholar]
- Cuzzi, J. N., & Zahnle, K. J. 2004, ApJ, 614, 490 [NASA ADS] [CrossRef] [Google Scholar]
- Cyr, K. E., Sears, W. D., & Lunine, J. I. 1998, Icarus, 135, 537 [Google Scholar]
- Danti, C., Bitsch, B., & Mah, J. 2023, A&A, 679, L7 [NASA ADS] [CrossRef] [EDP Sciences] [Google Scholar]
- Danti, C., Lambrechts, M., & Lorek, S. 2025, A&A, 700, A132 [NASA ADS] [CrossRef] [EDP Sciences] [Google Scholar]
- Dominik, C., & Tielens, A. G. G. M. 1997, ApJ, 480, 647 [Google Scholar]
- Drążkowska, J., & Dullemond, C. P. 2018, A&A, 614, A62 [NASA ADS] [CrossRef] [EDP Sciences] [Google Scholar]
- Drążkowska, J., Alibert, Y., & Moore, B. 2016, A&A, 594, A105 [Google Scholar]
- Drążkowska, J., Li, S., Birnstiel, T., Stammler, S. M., & Li, H. 2019, ApJ, 885, 91 [Google Scholar]
- Drążkowska, J., Stammler, S. M., & Birnstiel, T. 2021, A&A, 647, A15 [Google Scholar]
- Duffell, P. C. 2020, ApJ, 889, 16 [NASA ADS] [CrossRef] [Google Scholar]
- Dullemond, C. P., Birnstiel, T., Huang, J., et al. 2018, ApJ, 869, L46 [NASA ADS] [CrossRef] [Google Scholar]
- Easterwood, W., Kalyaan, A., & Banzatti, A. 2024, ApJ, 977, 21 [Google Scholar]
- Eriksson, L. E. J., Johansen, A., & Liu, B. 2020, A&A, 635, A110 [NASA ADS] [CrossRef] [EDP Sciences] [Google Scholar]
- Eriksson, L. E. J., Ronnet, T., & Johansen, A. 2021, A&A, 648, A112 [NASA ADS] [CrossRef] [EDP Sciences] [Google Scholar]
- Eriksson, L. E., Pfeil, T., Kaufmann, N., & Vaikundaraman, V. 2026, arXiv e-print [arXiv:2603.22550] [Google Scholar]
- Espaillat, C., D’Alessio, P., Hernández, J., et al. 2010, ApJ, 717, 441 [Google Scholar]
- Facchini, S., Curone, P., Benisty, M., et al. 2026, ApJ, 998, L16 [Google Scholar]
- Flaherty, K. M., Hughes, A. M., Rose, S. C., et al. 2017, ApJ, 843, 150 [NASA ADS] [CrossRef] [Google Scholar]
- Frediani, J., Bik, A., Ramírez-Tannus, M. C., et al. 2025, A&A, 701, A14 [NASA ADS] [CrossRef] [EDP Sciences] [Google Scholar]
- Gasman, D., Temmink, M., van Dishoeck, E. F., et al. 2025, A&A, 694, A147 [NASA ADS] [CrossRef] [EDP Sciences] [Google Scholar]
- Grant, S. L., van Dishoeck, E. F., Tabone, B., et al. 2023, ApJ, 947, L6 [NASA ADS] [CrossRef] [Google Scholar]
- Grant, S. L., Kurtovic, N. T., van Dishoeck, E. F., et al. 2024, A&A, 689, A85 [NASA ADS] [CrossRef] [EDP Sciences] [Google Scholar]
- Grant, S. L., Temmink, M., van Dishoeck, E. F., et al. 2025, A&A, 702, A126 [NASA ADS] [CrossRef] [EDP Sciences] [Google Scholar]
- Greenwood, A. J., Kamp, I., Waters, L. B. F. M., Woitke, P., & Thi, W.-F. 2019, A&A, 626, A6 [NASA ADS] [CrossRef] [EDP Sciences] [Google Scholar]
- Gundlach, B., Schmidt, K. P., Kreuzig, C., et al. 2018, MNRAS, 479, 1273 [NASA ADS] [CrossRef] [Google Scholar]
- Gurrutxaga, N., Drazkowska, J., Vaikundaraman, V., & Kleine, T. 2026, arXiv e-print [arXiv:2604.16604] [Google Scholar]
- Haisch, Jr, K. E., Lada, E. A., & Lada, C. J. 2001, ApJ, 553, L153 [NASA ADS] [CrossRef] [Google Scholar]
- Hartmann, L., Calvet, N., Gullbring, E., & D’Alessio, P. 1998, ApJ, 495, 385 [Google Scholar]
- Hartmann, L., Herczeg, G., & Calvet, N. 2016, ARA&A, 54, 135 [Google Scholar]
- Haugbølle, T., Weber, P., Wielandt, D. P., et al. 2019, AJ, 158, 55 [Google Scholar]
- Hensley, B. S., & Draine, B. 2023, ApJ, 948, 55 [Google Scholar]
- Homma, K. A., Okuzumi, S., Arakawa, S., & Fukai, R. 2024, PASJ, 76, 881 [Google Scholar]
- Houge, A., Johansen, A., Bergin, E., et al. 2025a, A&A, 699, A227 [NASA ADS] [CrossRef] [EDP Sciences] [Google Scholar]
- Houge, A., Krijt, S., Banzatti, A., et al. 2025b, MNRAS, 537, 691 [CrossRef] [Google Scholar]
- Huang, P., Yu, F., Lee, E. J., Dong, R., & Bai, X.-N. 2025, ApJ, 988, 94 [Google Scholar]
- Jang, H., Waters, R., Kaeufer, T., et al. 2024, A&A, 691, A148 [NASA ADS] [CrossRef] [EDP Sciences] [Google Scholar]
- Jiang, H., Macías, E., Guerra-Alvarado, O. M., & Carrasco-González, C. 2024, A&A, 682, A32 [NASA ADS] [CrossRef] [EDP Sciences] [Google Scholar]
- Johansen, A., & Lambrechts, M. 2017, Ann. Rev. Earth Planet. Sci., 45, 359 [Google Scholar]
- Johansen, A., Ronnet, T., Bizzarro, M., et al. 2021, Sci. Adv., 7, eabc0444 [NASA ADS] [CrossRef] [Google Scholar]
- Kalyaan, A., Pinilla, P., Krijt, S., Mulders, G. D., & Banzatti, A. 2021, ApJ, 921, 84 [CrossRef] [Google Scholar]
- Kalyaan, A., Pinilla, P., Krijt, S., et al. 2023, ApJ, 954, 66 [NASA ADS] [CrossRef] [Google Scholar]
- Kanagawa, K. D., Tanaka, H., Muto, T., & Tanigawa, T. 2017, PASJ, 69, 97 [NASA ADS] [CrossRef] [Google Scholar]
- Kanwar, J., Kamp, I., Jang, H., et al. 2024, A&A, 689, A231 [NASA ADS] [CrossRef] [EDP Sciences] [Google Scholar]
- Kaufmann, N. L., Pfeil, T., Stammler, S., et al. 2025, arXiv e-prints [arXiv:2511.20764] [Google Scholar]
- King, A. R., Pringle, J. E., & Livio, M. 2007, MNRAS, 376, 1740 [NASA ADS] [CrossRef] [Google Scholar]
- Krijt, S., Ciesla, F. J., & Bergin, E. A. 2016, ApJ, 833, 285 [Google Scholar]
- Krijt, S., Banzatti, A., Zhang, K., et al. 2025, ApJ, 990, L72 [Google Scholar]
- Kruijer, T. S., Burkhardt, C., Budde, G., & Kleine, T. 2017, Proc. Natl. Acad. Sci., 114, 6712 [Google Scholar]
- Lambrechts, M., Johansen, A., & Morbidelli, A. 2014, A&A, 572, A35 [NASA ADS] [CrossRef] [EDP Sciences] [Google Scholar]
- Lambrechts, M., Morbidelli, A., Jacobson, S. A., et al. 2019, A&A, 627, A83 [NASA ADS] [CrossRef] [EDP Sciences] [Google Scholar]
- Lau, T. C. H., Drążkowska, J., Stammler, S. M., Birnstiel, T., & Dullemond, C. P. 2022, A&A, 668, A170 [NASA ADS] [CrossRef] [EDP Sciences] [Google Scholar]
- Lau, T. C. H., Birnstiel, T., Drążkowska, J., & Stammler, S. M. 2024, A&A, 688, A22 [NASA ADS] [CrossRef] [EDP Sciences] [Google Scholar]
- Lau, T. C. H., Birnstiel, T., Stammler, S. M., & Drążkowska, J. 2025, ApJ, 994, 74 [Google Scholar]
- Li, R., & Youdin, A. N. 2021, ApJ, 919, 107 [NASA ADS] [CrossRef] [Google Scholar]
- Lienert, J. L., Bitsch, B., & Henning, T. 2024, A&A, 691, A72 [NASA ADS] [CrossRef] [EDP Sciences] [Google Scholar]
- Lim, J., Simon, J. B., Li, R., et al. 2024, ApJ, 969, 130 [NASA ADS] [CrossRef] [Google Scholar]
- Liu, B., Johansen, A., Lambrechts, M., Bizzarro, M., & Haugbølle, T. 2022, Sci. Adv., 8, eabm3045 [NASA ADS] [CrossRef] [Google Scholar]
- Lodders, K. 2003, ApJ, 591, 1220 [Google Scholar]
- Long, F., Pascucci, I., Houge, A., et al. 2025, ApJ, 978, L30 [Google Scholar]
- Lorek, S., & Lambrechts, M. 2026, A&A, 707, A244 [NASA ADS] [CrossRef] [EDP Sciences] [Google Scholar]
- Luo, L., Pinilla, P., Pulgarés, C., et al. 2026, MNRAS, https://doi.org/10.1093/mnras/stag423 [Google Scholar]
- Lynden-Bell, D., & Pringle, J. E. 1974, MNRAS, 168, 603 [Google Scholar]
- Lyra, W., Johansen, A., Zsom, A., Klahr, H., & Piskunov, N. 2009, A&A, 497, 869 [NASA ADS] [CrossRef] [EDP Sciences] [Google Scholar]
- Mah, J., Bitsch, B., Pascucci, I., & Henning, T. 2023, A&A, 677, L7 [CrossRef] [EDP Sciences] [Google Scholar]
- Mah, J., Savvidou, S., & Bitsch, B. 2024, A&A, 686, L17 [NASA ADS] [CrossRef] [EDP Sciences] [Google Scholar]
- Mallaney, P., Banzatti, A., Salyk, C., et al. 2026, arXiv e-prints [arXiv:2601.02344] [Google Scholar]
- Manara, C. F., Natta, A., Rosotti, G. P., et al. 2020, A&A, 639, A58 [NASA ADS] [CrossRef] [EDP Sciences] [Google Scholar]
- Mathis, J. S., Rumpl, W., & Nordsieck, K. H. 1977, ApJ, 217, 425 [Google Scholar]
- Miller, E., Marino, S., Stammler, S. M., et al. 2021, MNRAS, 508, 5638 [NASA ADS] [CrossRef] [Google Scholar]
- Mori, S., Bai, X.-N., & Okuzumi, S. 2019, ApJ, 872, 98 [NASA ADS] [CrossRef] [Google Scholar]
- Mori, S., Okuzumi, S., Kunitomo, M., & Bai, X.-N. 2021, ApJ, 916, 72 [NASA ADS] [CrossRef] [Google Scholar]
- Musiolik, G., & Wurm, G. 2019, ApJ, 873, 58 [NASA ADS] [CrossRef] [Google Scholar]
- Najita, J. R., Ádámkovics, M., & Glassgold, A. E. 2011, ApJ, 743, 147 [NASA ADS] [CrossRef] [Google Scholar]
- Najita, J. R., Carr, J. S., Pontoppidan, K. M., et al. 2013, ApJ, 766, 134 [Google Scholar]
- Nicholson, L., & Bae, J. 2025, ApJ, 994, 234 [Google Scholar]
- Olofsson, J., Benisty, M., Le Bouquin, J.-B., et al. 2013, A&A, 552, A4 [NASA ADS] [CrossRef] [EDP Sciences] [Google Scholar]
- Ormel, C. W., & Cuzzi, J. N. 2007, A&A, 466, 413 [NASA ADS] [CrossRef] [EDP Sciences] [Google Scholar]
- Pascucci, I., Apai, D., Luhman, K., et al. 2009, ApJ, 696, 143 [Google Scholar]
- Pascucci, I., Herczeg, G., Carr, J. S., & Bruderer, S. 2013, ApJ, 779, 178 [NASA ADS] [CrossRef] [Google Scholar]
- Pätzold, M., Andert, T., Hahn, M., et al. 2016, Nature, 530, 63 [CrossRef] [Google Scholar]
- Perotti, G., Christiaens, V., Henning, T., et al. 2023, Nature, 620, 516 [NASA ADS] [CrossRef] [Google Scholar]
- Petrovic, H. J., Booth, R. A., & Clarke, C. J. 2024, MNRAS, 534, 2412 [Google Scholar]
- Pfeil, T., Birnstiel, T., & Klahr, H. 2024, A&A, 691, A45 [NASA ADS] [CrossRef] [EDP Sciences] [Google Scholar]
- Pfeil, T., Armitage, P. J., & Jiang, Y.-F. 2025, ApJ, 994, 272 [Google Scholar]
- Pinilla, P., Benisty, M., & Birnstiel, T. 2012, A&A, 545, A81 [NASA ADS] [CrossRef] [EDP Sciences] [Google Scholar]
- Pinilla, P., Klarmann, L., Birnstiel, T., et al. 2016, A&A, 585, A35 [NASA ADS] [CrossRef] [EDP Sciences] [Google Scholar]
- Pinilla, P., Lenz, C. T., & Stammler, S. M. 2021, A&A, 645, A70 [NASA ADS] [CrossRef] [EDP Sciences] [Google Scholar]
- Pinilla, P., Benisty, M., Waters, R., Bae, J., & Facchini, S. 2024, A&A, 686, A135 [NASA ADS] [CrossRef] [EDP Sciences] [Google Scholar]
- Pontoppidan, K. M., Salyk, C., Blake, G. A., et al. 2010, ApJ, 720, 887 [CrossRef] [Google Scholar]
- Pontoppidan, K. M., Salyk, C., Bergin, E. A., et al. 2014, in Protostars and Planets VI, eds. H. Beuther, R. S. Klessen, C. P. Dullemond, & T. Henning (Tucson: University of Arizona), 363 [Google Scholar]
- Rafikov, R. R. 2017, ApJ, 837, 163 [NASA ADS] [CrossRef] [Google Scholar]
- Rice, W. K. M., Armitage, P. J., Wood, K., & Lodato, G. 2006, MNRAS, 373, 1619 [Google Scholar]
- Romero-Mirza, C. E., Banzatti, A., Öberg, K. I., et al. 2024, ApJ, 975, 78 [NASA ADS] [CrossRef] [Google Scholar]
- Rosotti, G. P., Teague, R., Dullemond, C., Booth, R. A., & Clarke, C. J. 2020, MNRAS, 495, 173 [Google Scholar]
- Rota, A. A., Meijerhof, J. D., van der Marel, N., et al. 2024, A&A, 684, A134 [NASA ADS] [CrossRef] [EDP Sciences] [Google Scholar]
- Rota, A., Van Der Marel, N., Garufi, A., et al. 2025, A&A, 700, A32 [NASA ADS] [CrossRef] [EDP Sciences] [Google Scholar]
- Salyk, C., Blake, G. A., Boogert, A. C. A., & Brown, J. M. 2011a, ApJ, 743, 112 [NASA ADS] [CrossRef] [Google Scholar]
- Salyk, C., Pontoppidan, K. M., Blake, G. A., Najita, J. R., & Carr, J. S. 2011b, ApJ, 731, 130 [Google Scholar]
- Schneider, A. D., & Bitsch, B. 2021, A&A, 654, A71 [Google Scholar]
- Schoonenberg, D., Ormel, C. W., & Krijt, S. 2018, A&A, 620, A134 [NASA ADS] [CrossRef] [EDP Sciences] [Google Scholar]
- Sellek, A. D., & van Dishoeck, E. F. 2025, A&A, 701, A239 [NASA ADS] [CrossRef] [EDP Sciences] [Google Scholar]
- Sellek, A. D., Vlasblom, M., & van Dishoeck, E. F. 2025, A&A, 694, A79 [NASA ADS] [CrossRef] [EDP Sciences] [Google Scholar]
- Semenov, D., & Wiebe, D. 2011, ApJS, 196, 25 [Google Scholar]
- Shakura, N. I., & Sunyaev, R. A. 1973, A&A, 24, 337 [NASA ADS] [Google Scholar]
- Sierra, A., Benisty, M., Pinilla, P., et al. 2025, MNRAS, 541, 3101 [Google Scholar]
- Simon, J. B., Armitage, P. J., Li, R., & Youdin, A. N. 2016, ApJ, 822, 55 [Google Scholar]
- Stammler, S. M., & Birnstiel, T. 2022, ApJ, 935, 35 [NASA ADS] [CrossRef] [Google Scholar]
- Stammler, S. M., Lichtenberg, T., Drążkowska, J., & Birnstiel, T. 2023, A&A, 670, L5 [NASA ADS] [CrossRef] [EDP Sciences] [Google Scholar]
- Tabone, B., Bettoni, G., Van Dishoeck, E., et al. 2023, Nat. Astron., 7, 805 [NASA ADS] [CrossRef] [Google Scholar]
- Tabone, B., Rosotti, G. P., Cridland, A. J., Armitage, P. J., & Lodato, G. 2022, MNRAS, 512, 2290 [NASA ADS] [CrossRef] [Google Scholar]
- Tazaki, R., & Dominik, C. 2022, A&A, 663, A57 [NASA ADS] [CrossRef] [EDP Sciences] [Google Scholar]
- Teague, R., Henning, T., Guilloteau, S., et al. 2018, ApJ, 864, 133 [NASA ADS] [CrossRef] [Google Scholar]
- Temmink, M., Sellek, A. D., Gasman, D., et al. 2025, A&A, 699, A134 [NASA ADS] [CrossRef] [EDP Sciences] [Google Scholar]
- Tong, S., Alexander, R., & Rosotti, G. 2026, MNRAS, 545, staf2128 [Google Scholar]
- Ueda, T., Tazaki, R., Okuzumi, S., Flock, M., & Sudarshan, P. 2024, Nat. Astron., 8, 1148 [NASA ADS] [CrossRef] [Google Scholar]
- Van Clepper, E., Price, E. M., & Ciesla, F. J. 2025a, ApJ, 980, 201 [Google Scholar]
- Van Clepper, E. R., Alarcón, F., Bergin, E., & Ciesla, F. J. 2025b, ApJ, 994, L44 [Google Scholar]
- van Dishoeck, E. F., & the MINDS team. 2024, arXiv e-prints [arXiv:2412.07853] [Google Scholar]
- Van Kooten, E. M. M. E., Wielandt, D., Schiller, M., et al. 2016, Proc. Natl. Acad. Sci., 113, 2011 [Google Scholar]
- Villenave, M., Rosotti, G. P., Lambrechts, M., et al. 2025, A&A, 697, A64 [NASA ADS] [CrossRef] [EDP Sciences] [Google Scholar]
- Vlasblom, M., Temmink, M., Sellek, A. D., & van Dishoeck, E. F. 2025, A&A, 703, A52 [NASA ADS] [CrossRef] [EDP Sciences] [Google Scholar]
- Wafflard-Fernandez, G., & Lesur, G. 2023, A&A, 677, A70 [NASA ADS] [CrossRef] [EDP Sciences] [Google Scholar]
- Wang, Y., Ormel, C. W., Mori, S., & Bai, X.-N. 2025, A&A, 696, A38 [NASA ADS] [CrossRef] [EDP Sciences] [Google Scholar]
- Weber, P., Benítez-Llambay, P., Gressel, O., Krapp, L., & Pessah, M. E. 2018, ApJ, 854, 153 [NASA ADS] [CrossRef] [Google Scholar]
- Weber, P., Pérez, S., Benítez-Llambay, P., et al. 2019, ApJ, 884, 178 [NASA ADS] [CrossRef] [Google Scholar]
- Weidenschilling, S. 1997, Icarus, 127, 290 [NASA ADS] [CrossRef] [Google Scholar]
- Williams, J., & Krijt, S. 2025, MNRAS, 537, 831 [Google Scholar]
- Williams, J., Krijt, S., Bitsch, B., Houge, A., & Bergner, J. 2025, MNRAS, 544, 3562 [Google Scholar]
- Woitke, P., Min, M., Thi, W.-F., et al. 2018, A&A, 618, A57 [NASA ADS] [CrossRef] [EDP Sciences] [Google Scholar]
- Xiang, C., Matthews, L., Carballido, A., & Hyde, T. 2020, ApJ, 897, 182 [NASA ADS] [CrossRef] [Google Scholar]
- Xie, C., Pascucci, I., Long, F., et al. 2023, ApJ, 959, L25 [NASA ADS] [CrossRef] [Google Scholar]
- Zhao, H., Lau, T. C. H., Birnstiel, T., Stammler, S. M., & Drążkowska, J. 2025, A&A, 694, A205 [NASA ADS] [CrossRef] [EDP Sciences] [Google Scholar]
- Zhu, Z., Nelson, R. P., Dong, R., Espaillat, C., & Hartmann, L. 2012, ApJ, 755, 6 [Google Scholar]
We used DustPy v1.0.8 for the simulations presented in this paper.
Note that as it is based on the Smoluchowski approach and discretized only in the space and size dimensions, DustPy cannot self-consistently include the evolution of the dust porosity.
This assumption is only used to acquire a gap profile and a local pressure maximum. Our results remain valid for local pressure bumps originating from other processes.
Streaming instability simulations by Simon et al. (2016) found that about half of the pebbles were turned into planetesimals over a few orbital periods, corresponding to ζ ≈ 10−3–10−2 (Drążkowska et al. 2016).
Note that dust diffusion, which is included in DustPy, also affects dust transport and will increase the leakiness of traps.
As discussed in Sect. 2.3, our one-dimensional approach does not allow us to model the gas flow close to the planet, where small grains are most likely to cross (Petrovic et al. 2024; Van Clepper et al. 2025a). This could change the velocity of grains once in the gap, though they should still move inwards.
The timescale to settle in a new fragmentation-limited equilibrium may be longer than the gap crossing time, especially for strong pressure maxima leading to low dust densities and collision rates in the gap. In that case, the particle size may be lower than the fragmentation barrier.
For example, having a very low particle size would significantly reduce the radial drift of dust grains, hence leading to a small Mcross, even though gaps are more leaky with regard to small pebbles.
Moreover, solid mass stored in planetesimals may be returned to small dust grains via ablation, in which case the leaking flux would be more significant (Eriksson et al. 2021). This effect is not included in this work.
The disc SR 4 has a lower cold water vapour mass than CI Tau but larger error bars, such that we pick CI Tau as a lower limit.
The volatile reservoir of carbon also consists of CO and CO2, but we do not consider them as they contain oxygen and hence are not able to elevate the gas-phase C/O above unity.
With a higher water ice mass fraction on pebbles fH2O,ice = 0.5 (Lodders 2003), this number falls to one dust trap, corresponding to a 300 M⊕ planet at 40 au.
Appendix A Removing the dust reservoir
As mentioned in Sect. 2, we initially empty the dust reservoir inside the planetary gap, such that with ongoing evolution, the dust surface density inside the gap has to originate from the leakiness of the dust trap. Moreover, this reduces the computational expense of DustPy, highly simplifying our parameter space exploration. To ensure that this approach does not modify our results (pebble flux, blocking efficiency), we compare the results of simulations with inner disc dust emptied out with full simulations, which were shown in Fig. 11. The different simulations correspond to δturb = 10−4 and a sample of viscosity αvisc, which samples different blocking efficiency regime.
We present in Fig. A.1 the pebble flux at 1 au and 30 au with and without inner disc dust initially present for a disc with a 100 M⊕ planet at 10 au. When inner disc dust is initially emptied out, we see that the pebble flux reaching 1 au takes longer to increase, which corresponds to the reservoir of solids inside the gap that was removed. Once the pebble front coming from outside the gap reaches 1 au, the pebble flux in both simulations becomes similar. The timescale for the pebble flux of both simulations to adjust can inform us on the time it takes for the inner disc to feel the effect of the outer dust trap, referred to as tdelay in Krijt et al. (2025). We see that it is not necessarily identical to the drift timescale, but that the blocking efficiency of the dust trap slows down the transport of particles and increase that delay. This is due to the cycle of fragmentation and re-coagulation dust grains have to go through in order to escape the dust trap. Focusing on the blocking efficiency after 5 Myr, we see that this quantity is unaffected by our approach.
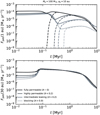 |
Fig. A.1 Pebble flux Fpeb inside the planetary gap (1 au, upper panel) and outside the planetary gap (30 au, lower panel) for a disc with a 100 M⊕ planet at 10 au. Solid lines correspond to full simulations, while dashed lines show those where dust has been initially emptied out inside of the gap. The different shades indicate different simulations with δturb = 10−4 and varying viscosity, which sample well the different blocking efficiency regime. Low viscosity (αvisc = 10−3) is highly blocking, while strong viscosity (αvisc = 10−2) are highly permeable. |
Overall, emptying the inner dust disc is a powerful way to reduce the computational expense of DustPy and allows to directly relate the dust mass of the inner disc to what has leaked through the trap. Otherwise, the implementation of a passive tracer on dust particles (as in Pfeil et al. 2025) would be necessary to disentangle what fraction of the inner disc mass originates from the inner or outer disc.
Appendix B Pebble flux in DustPy versus two-pop-py
To further highlights the differences between simpler dust evolution codes, like two-pop-py, and full dust coagulation approaches like DustPy, we present in Fig. B.1 the pebble flux at 1 au for a disc with a 100 M⊕ planet at 10 au for both codes. We focus here on fragile grains (vfrag = 1 m s−1), corresponding to the left-column in the upper panel in Fig. 10. We clearly see the discontinuity in the pebble flux modelled by two-pop-py: slightly increasing the gap depth (i.e. here lowering the viscosity) halt the drift motion of the whole dust population, as it moves at a common mass-weighted average speed. Then, the only way for dust to leak towards the inner disc is with diffusion, which barely varies as simulations shown here have a constant δturb = 10−4. This discontinuity in dust transport is at the origin of the sharp transition between Regime II and III discussed in Mah et al. (2024). Meanwhile, the pebble flux modelled by DustPy is consistently higher, and better captures the gradual decrease in leakiness as the dust trap gets stronger. DustPy thus predicts a longer-lived oxygen-rich inner disc composition for discs with dust traps (i.e. Regime II extended over a much larger parameter space, see Mah et al. 2024), as compared with predictions from two-pop-py.
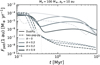 |
Fig. B.1 Pebble flux Fpeb inside the planetary gap (1 au) for a disc with a 100 M⊕ planet at 10 au. Solid lines correspond to full simulations with DustPy, while dashed lines show the results of two-pop-py. Different shades indicate different simulations with δturb = 10−4 and varying viscosity (see also Fig. A.1). |
All Figures
|
Fig. 1 Schematic representing a protoplanetary disc with a gap created by the presence of a giant planet. The gas pressure profile is modified, resulting in the filtering of particles; pebbles are blocked, while small grains leak past the gap. The key processes influencing the leakiness of dust traps included in our work are highlighted. |
| In the text | |
|
Fig. 2 Radial profile of the gas surface density Σg (upper panels) and disc viscosity αvisc (lower panels) including a dust trap caused by a different planet mass and location, whose shape and depth is computed using empirical fits from Kanagawa et al. (2017). We pick here our lowest value of the viscosity (αvisc,0 = 10−3) that produces the deepest gaps in our parameter study. For comparison, Mp = 300 M⊕ corresponds to an approximately Jupiter-mass planet. |
| In the text | |
|
Fig. 3 Vertically-integrated dust density distribution as a function of particle size for a disc with a gap carved by a 100 M⊕ planet at 10 au (upper panels) compared to a smooth disc (lower panels). In the model shown here, the disc viscosity is set to αvisc = 10−3 and the local turbulence to δturb = 3.2 × 10⁻⁴. The colour bar indicates the surface density of dust in a given size range at a given radius. The three panels represent different times of the simulation (t = 0.2 Myr, t = 1 Myr, and t = 5 Myr). The black contours show different values of the Stokes number (St = [10−3, 10−2, 10−1, 100]) for visual guidance. |
| In the text | |
|
Fig. 4 Dust velocity as a function of distance from the star and dust Stokes number in a disc hosting a 100 M⊕ planet that has carved a gap at 10 au (upper panel) compared to a smooth disc (lower panel) for a global viscosity αvisc = 10−3 and local turbulence δturb = 3.2 × 10⁻⁴. Negative velocity represents the inwards motion of dust grains (red) while a positive velocity shows the outwards motion (blue). The dark contours represent the variations in Stokes number for fixed particle size (from 1 μm to 1 mm). The Stokes number decreases monotonously in the smooth disc when approaching the star. In planet-hosting discs, low gas density in the planetary gap increases the Stokes number locally. |
| In the text | |
|
Fig. 5 Key diagnostic quantities to quantify the leakiness of dust traps, here for the fiducial model of a disc with a 100 M⊕ planet that has carved a gap at 10 au for a global viscosity αvisc = 10−3 and local turbulence δturb = 3.2 × 10⁻⁴. Upper panel: pebble flux Fpeb outside the planetary gap (30 au, blue) and reaching the inner disc at 1 au (red), for a planet-hosting disc (solid line) or smooth disc (dashed line). Middle panel: total solid mass Mcross that has crossed the radial location rgap = 10 au since t0 as a function of time for a planet-hosting disc (solid line) and smooth disc (dashed line). The horizontal dotted line indicates the total solid mass initially located outside of 10 au. Lower panel: Trap blocking efficiency ℬ of the dust trap since t0 as a function of time (see Eq. (4)). |
| In the text | |
|
Fig. 6 Trap blocking efficiency ℬ (Eq. (4)) of a dust trap by t = 5 Myr for a range of planet mass Mp (30, 100, 300 M⊕) and location ap (5, 10, 40 au). The fragmentation velocity is set to vfrag = 1 m s−1 (Sect. 2.1). For each case, we run simulations for 25 pairs of viscosity αvisc and local turbulence δturb. In total, 300 simulations were used to build this figure. As discussed in Sect. 3.1, a blocking efficiency close to zero indicates a highly permeable dust trap, while a blocking efficiency approaching unity corresponds to a highly blocking trap. We indicate an estimate of the Stokes number of fragmentation-limited pebbles ( |
| In the text | |
|
Fig. 7 Trap blocking efficiency of a dust trap carved by a 100 M⊕ planet at 10 au by t = 5 Myr for resistant dust grains (vfrag = 3 m s−1), for a range of viscosity αvisc and local turbulence δturb. We indicate an estimate of the Stokes number of fragmentation-limited pebbles ( |
| In the text | |
|
Fig. 8 Mass of planetesimals formed in the dust trap generated by a planet at 10 au by the end of our simulations for a range of viscosity αvisc, local turbulence δturb and planet mass Mp. We see that under specific conditions, dust traps can be strong enough to form planetesimals. In that case, a large fraction of the available outer disc dust mass (see Fig. 5) may be transferred into planetesimals. |
| In the text | |
|
Fig. 9 Pebble flux at 1 au and dust trap blocking efficiency ℬ as a function of time for simulations with or without planetesimal formation. We focus on the case of a gap carved by a 100 M⊕ planet at 10 au, in which case only three simulations reach the requirements for planetesimal formation (δturb = 10−4 and αvisc ∈ [10−3, 3.2 × 10⁻³], see Fig. 8). We see that highly blocking dust traps (ℬ > 0.9) can only be achieved thanks to planetesimal formation. If planetesimals did not form, a dust trap in the same disc conditions would be much leakier. |
| In the text | |
|
Fig. 10 Comparison between the dust trap blocking efficiency found by our full grain size distribution model based on DustPy, ℬDustPy, and the simpler two-population algorithm, ℬ2pop (Birnstiel et al. 2012) here incorporated within chemcomp (Schneider & Bitsch 2021), for identical disc models with fragile grains (upper panel) and resistant grains (lower panel). We see that simpler dust evolution models can overestimate the amount of mass blocked in dust traps by orders of magnitude, hence they may significantly underestimate the flux of outer disc material reaching the inner disc. |
| In the text | |
|
Fig. 11 Pebble flux through the iceline (left axis) and observable cold water vapour mass (right axis) versus time for different dust trap leakiness and parameters. The different colours indicate simulations with δturb = 10−4 and varying viscosity from αvisc = 10−3 (most blocking, dark blue) to αvisc = 10−2 (fully permeable, light blue). We present these four cases because as seen in Fig. 6, varying the viscosity across this column samples well the different leakiness regimes. Note that for weak traps (e.g. with Mp = 30 M⊕), even the most blocking trap is quite leaky. Grey dots indicate measurements of the vapour reservoir made with JWST (see Figure 2 in Krijt et al. 2025) and converted into pebble flux following Eq. (6). The title of each panel indicates the parameter that is varied from the standard fiducial values: vfrag = 1 m s−1, Mp = 100 M⊕, ap = 10 au and Mdisc = 0.05 M⊙. The grey star label and horizontal line indicate an estimate of the error on the disc age (~0.5 Myr, Krijt et al. 2025). |
| In the text | |
|
Fig. 12 Mass flux of oxygen (stored in water ice, solid lines) and carbon (in gas-phase CH4, dashed lines) at 1 au as a function of time, for a disc with a gap carved by a 100 M⊕ planet at 10 au. As in Fig. 11, we focus on simulations with δturb = 10−4 and varying viscosity, as these sample the different leakiness regimes well. We see that the pebble flux is always above the flux of C-rich gas, meaning that it is challenging for outer dust traps to result in inner disc gas-phase C/O above unity. |
| In the text | |
|
Fig. 13 Ratio of the cumulative mass flux (Eq. (3)) reaching 1 au of simulations with outer traps at 40 au relative to simulations with inner traps at 5 au both carved by a 100 M⊕ planet, for different blocking efficiency regime as in Fig. 11. The ratio changes from above to below unity, indicating that in early stages (t < 1 Myr) inner dust traps have a greater impact on the delivery of material to the iceline, while at later stages (t > 1 Myr) their overall higher leakiness makes them less impactful. |
| In the text | |
|
Fig. A.1 Pebble flux Fpeb inside the planetary gap (1 au, upper panel) and outside the planetary gap (30 au, lower panel) for a disc with a 100 M⊕ planet at 10 au. Solid lines correspond to full simulations, while dashed lines show those where dust has been initially emptied out inside of the gap. The different shades indicate different simulations with δturb = 10−4 and varying viscosity, which sample well the different blocking efficiency regime. Low viscosity (αvisc = 10−3) is highly blocking, while strong viscosity (αvisc = 10−2) are highly permeable. |
| In the text | |
|
Fig. B.1 Pebble flux Fpeb inside the planetary gap (1 au) for a disc with a 100 M⊕ planet at 10 au. Solid lines correspond to full simulations with DustPy, while dashed lines show the results of two-pop-py. Different shades indicate different simulations with δturb = 10−4 and varying viscosity (see also Fig. A.1). |
| In the text | |
Current usage metrics show cumulative count of Article Views (full-text article views including HTML views, PDF and ePub downloads, according to the available data) and Abstracts Views on Vision4Press platform.
Data correspond to usage on the plateform after 2015. The current usage metrics is available 48-96 hours after online publication and is updated daily on week days.
Initial download of the metrics may take a while.