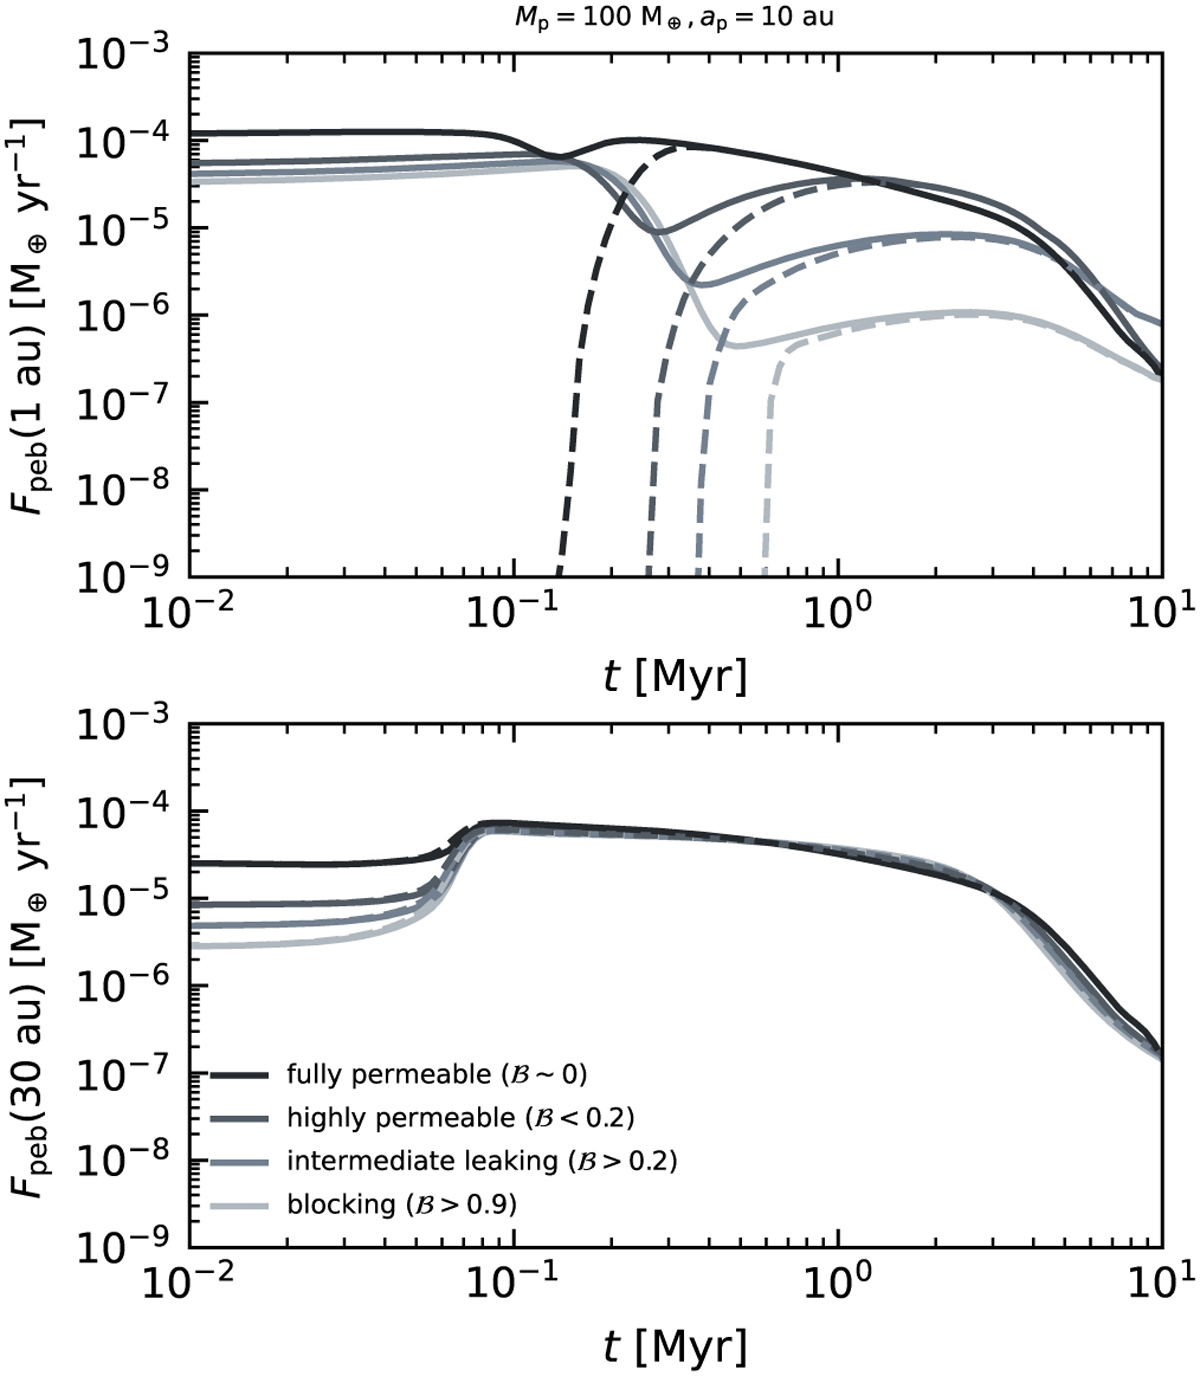
Fig. A.1
Download original image
Pebble flux Fpeb inside the planetary gap (1 au, upper panel) and outside the planetary gap (30 au, lower panel) for a disc with a 100 M⊕ planet at 10 au. Solid lines correspond to full simulations, while dashed lines show those where dust has been initially emptied out inside of the gap. The different shades indicate different simulations with δturb = 10−4 and varying viscosity, which sample well the different blocking efficiency regime. Low viscosity (αvisc = 10−3) is highly blocking, while strong viscosity (αvisc = 10−2) are highly permeable.
Current usage metrics show cumulative count of Article Views (full-text article views including HTML views, PDF and ePub downloads, according to the available data) and Abstracts Views on Vision4Press platform.
Data correspond to usage on the plateform after 2015. The current usage metrics is available 48-96 hours after online publication and is updated daily on week days.
Initial download of the metrics may take a while.