Fig. 3
Download original image
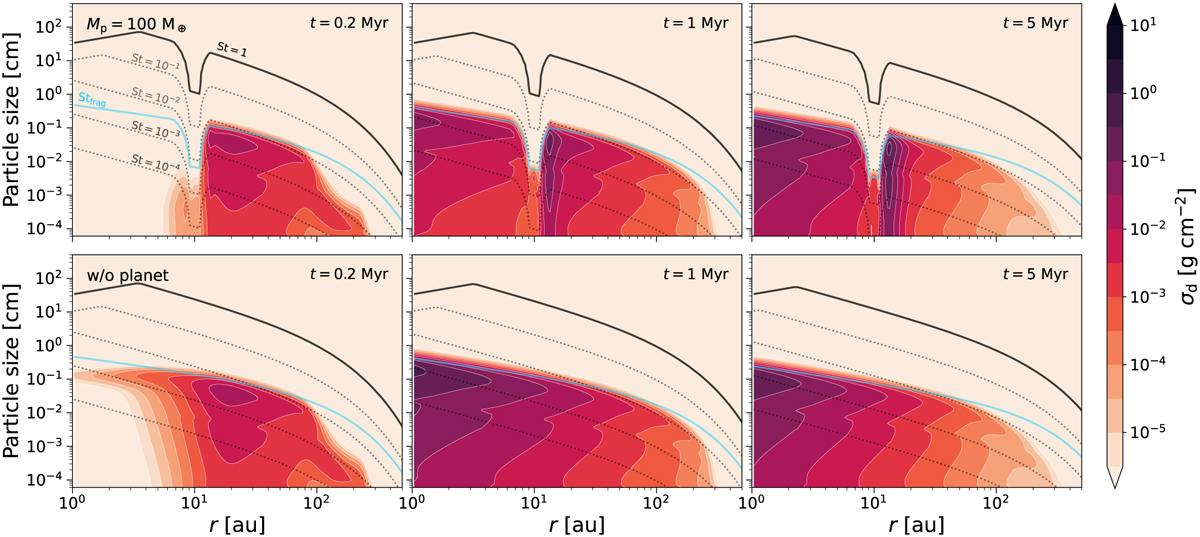
Vertically-integrated dust density distribution as a function of particle size for a disc with a gap carved by a 100 M⊕ planet at 10 au (upper panels) compared to a smooth disc (lower panels). In the model shown here, the disc viscosity is set to αvisc = 10−3 and the local turbulence to δturb = 3.2 × 10⁻⁴. The colour bar indicates the surface density of dust in a given size range at a given radius. The three panels represent different times of the simulation (t = 0.2 Myr, t = 1 Myr, and t = 5 Myr). The black contours show different values of the Stokes number (St = [10−3, 10−2, 10−1, 100]) for visual guidance.
Current usage metrics show cumulative count of Article Views (full-text article views including HTML views, PDF and ePub downloads, according to the available data) and Abstracts Views on Vision4Press platform.
Data correspond to usage on the plateform after 2015. The current usage metrics is available 48-96 hours after online publication and is updated daily on week days.
Initial download of the metrics may take a while.