Fig. 5
Download original image
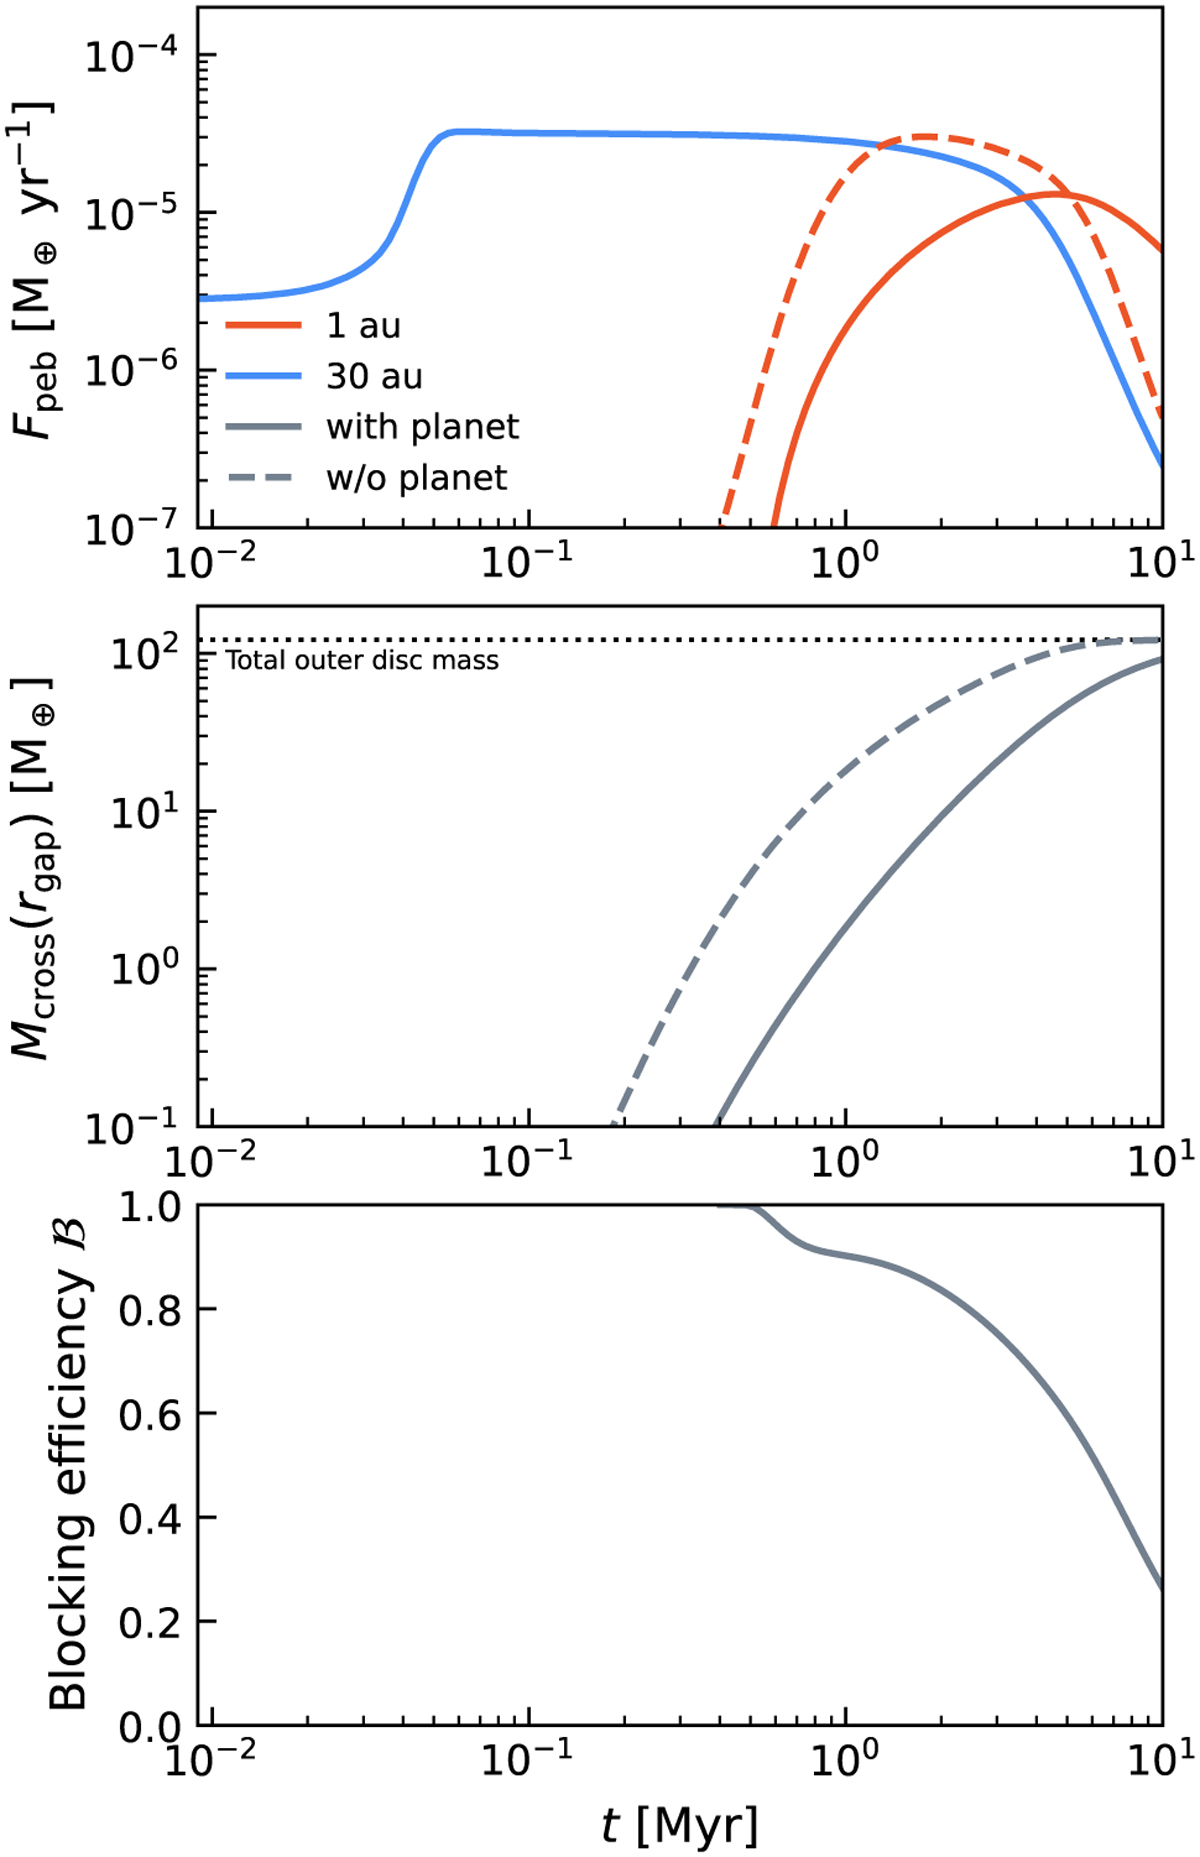
Key diagnostic quantities to quantify the leakiness of dust traps, here for the fiducial model of a disc with a 100 M⊕ planet that has carved a gap at 10 au for a global viscosity αvisc = 10−3 and local turbulence δturb = 3.2 × 10⁻⁴. Upper panel: pebble flux Fpeb outside the planetary gap (30 au, blue) and reaching the inner disc at 1 au (red), for a planet-hosting disc (solid line) or smooth disc (dashed line). Middle panel: total solid mass Mcross that has crossed the radial location rgap = 10 au since t0 as a function of time for a planet-hosting disc (solid line) and smooth disc (dashed line). The horizontal dotted line indicates the total solid mass initially located outside of 10 au. Lower panel: Trap blocking efficiency ℬ of the dust trap since t0 as a function of time (see Eq. (4)).
Current usage metrics show cumulative count of Article Views (full-text article views including HTML views, PDF and ePub downloads, according to the available data) and Abstracts Views on Vision4Press platform.
Data correspond to usage on the plateform after 2015. The current usage metrics is available 48-96 hours after online publication and is updated daily on week days.
Initial download of the metrics may take a while.