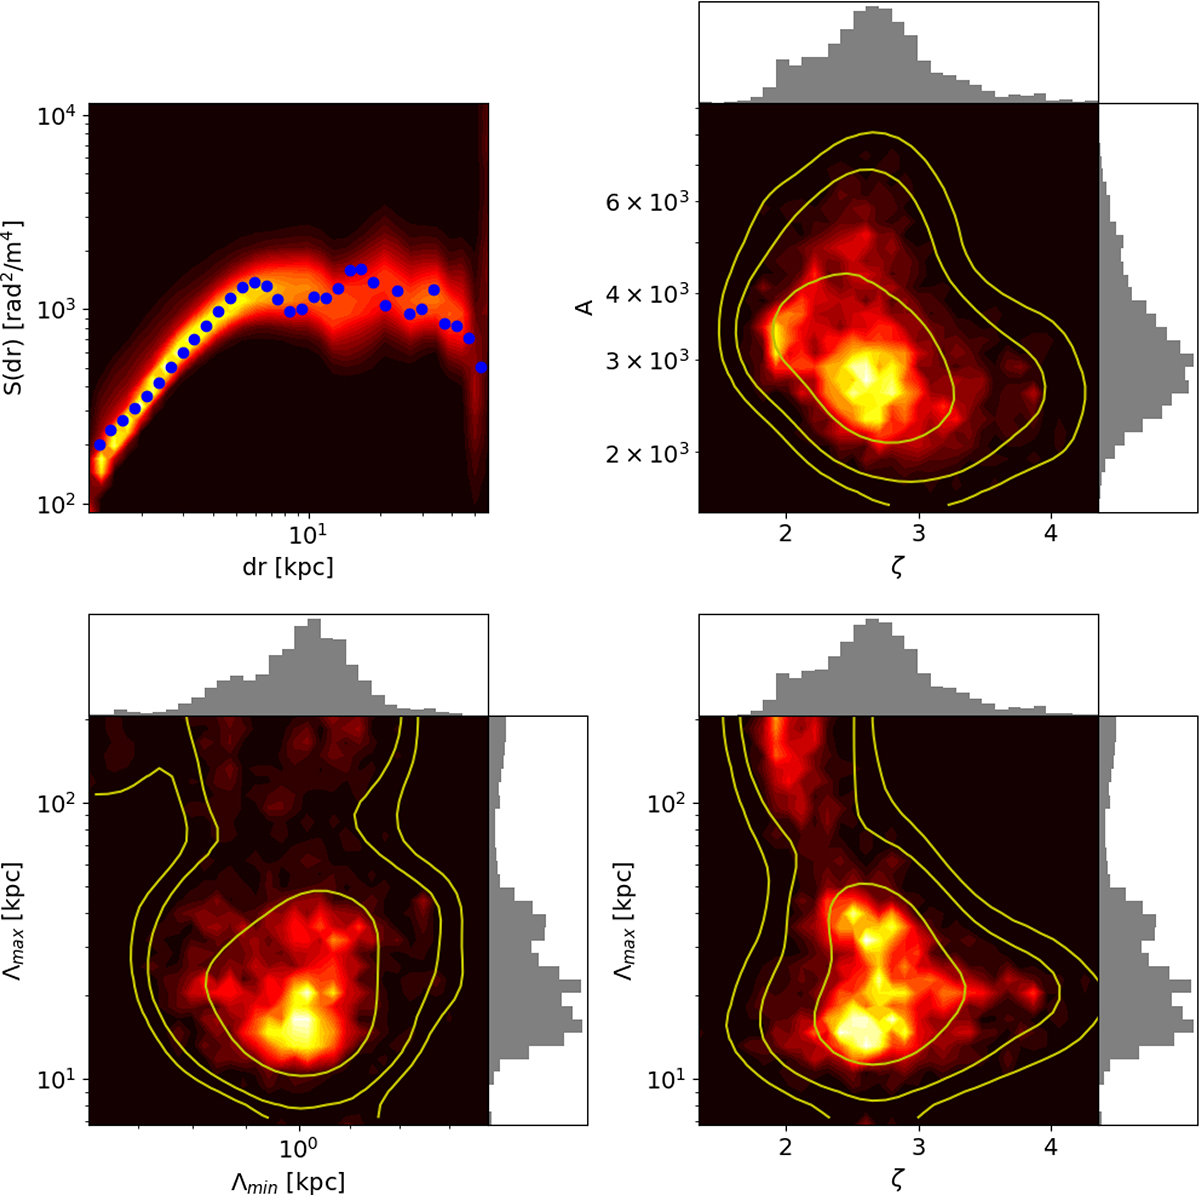
Fig. 1.
Download original image
Magnetic field power spectrum measurements. Top left: Comparison between the observed(blue points) and simulated RM structure functions. Top right, bottom left, and bottom right: Posterior distributions of normalisation vs slope, maximum vs minimum scales, and maximum scale vs slope, respectively. The last three panels show histograms of each parameter. The contours show the 1, 2, and 3σ levels associated with the distributions.
Current usage metrics show cumulative count of Article Views (full-text article views including HTML views, PDF and ePub downloads, according to the available data) and Abstracts Views on Vision4Press platform.
Data correspond to usage on the plateform after 2015. The current usage metrics is available 48-96 hours after online publication and is updated daily on week days.
Initial download of the metrics may take a while.