| Issue |
A&A
Volume 710, June 2026
|
|
|---|---|---|
| Article Number | A96 | |
| Number of page(s) | 11 | |
| Section | Extragalactic astronomy | |
| DOI | https://doi.org/10.1051/0004-6361/202659964 | |
| Published online | 03 June 2026 | |
The MeerKAT Fornax Survey
VII. Characterisation of the Fornax cluster’s magnetic field and new insights on magnetisation in large-scale systems
1
INAF – Osservatorio Astronomico di Cagliari, Via della Scienza 5, Selargius, Italy
2
Ruhr University Bochum, Faculty of Physics and Astronomy, Astronomical Institute (AIRUB), 44780 Bochum, Germany
3
Wits Centre for Astrophysics, School of Physics, University of the Witwatersrand, 1 Jan Smuts Avenue, 2000 Johannesburg, South Africa
4
Netherlands Institute for Radio Astronomy (ASTRON), Oude Hoogeveensedijk 4, 7991 PD, Dwingeloo, The Netherlands
★ Corresponding author: This email address is being protected from spambots. You need JavaScript enabled to view it.
Received:
20
March
2026
Accepted:
9
April
2026
Abstract
Large-scale magnetic fields in galaxy clusters can influence their physics and the evolution of cluster-embedded galaxies. These properties remain poorly constrained due to a historical lack of high-sensitivity and high-resolution spectropolarimetric data. Thanks to the advent of the Square Kilometre Array pathfinders and precursors, this situation is now dramatically changing. Using the densest rotation measure (RM) grid produced to date from broadband spectropolarimetric data within the MeerKAT Fornax Survey (508 sources over 6.35 deg2; presented in a previous paper), we aim to study the Fornax cluster’s magnetic field in detail. We compared the RM grid properties with numerical simulations to constrain the strength and the structure of the intracluster magnetic field. We modelled the magnetic field power spectrum with a power law, and find a slope of 2.7+0.2−0.4, fluctuating between minimum and a maximum scales of 1.01+0.01−0.02 and 15+9−2 kpc, respectively. It has a central strength of 5.0+0.3−0.4 μG, decreasing with the thermal plasma density according to a power–law exponent η = 1.6+0.3−0.5, the highest value to date in large-scale systems. By analysing a sample of 17 galaxy clusters and groups with magnetic field estimates from the literature, we observe longer autocorrelation lengths in the case of massive merging clusters and lower values for relaxed clusters and low-mass clusters or galaxy groups. We also observe a systematic increase in the central magnetic field strength as a function of central density, B0 ∝ n0(0.38 ± 0.14). We argue that the steepening of the Fornax cluster’s magnetic field profile and its relatively high central strength could indicate a recent re-amplification at the centre due to the extended central radio galaxy. The sample analysis supports the proposed scenario; however, more detailed magnetic field studies conducted using consistent modelling on larger samples are needed to better understand magnetisation in clusters and groups.
Key words: magnetic fields / polarization / galaxies: clusters: individual: Fornax cluster
© The Authors 2026
 Open Access article, published by EDP Sciences, under the terms of the Creative Commons Attribution License (https://creativecommons.org/licenses/by/4.0), which permits unrestricted use, distribution, and reproduction in any medium, provided the original work is properly cited.
This article is published in open access under the Subscribe to Open model. This email address is being protected from spambots. You need JavaScript enabled to view it. to support open access publication.
1. Introduction
Cosmic magnetism is one of the scientific drivers of the Square Kilometre Array (SKA) telescope. The origin and evolution of large-scale magnetic fields embedded in galaxy clusters and along the cosmic web filaments is still uncertain.
Large-scale magnetic fields in clusters can affect galaxy evolution, as recently observed by Müller et al. (2021), and accelerate particles, creating the so-called diffuse radio sources (see the review by van Weeren et al. 2019). Moreover, they can affect galaxy cluster physics by altering heat conduction, gas mixing in the intracluster medium (ICM), and the propagation of cosmic rays (e.g. Pfrommer et al. 2017; Ruszkowski & Oh 2010). Achieving a comprehensive understanding of galaxy cluster physics requires constraining the properties of intracluster magnetic fields.
This can be achieved using both background and cluster-embedded polarised sources to reconstruct the rotation measure (RM). The Faraday effect enables this reconstruction, whereby the polarisation plane of a background source crossing an external magnetoionic medium (the galaxy cluster) rotates as a function of the RM and of the rest frame wavelength squared λ2,
 (1)
(1)
where ΔΨ is the change in polarisation angle. The RM is linked to the properties of the magnetic field through
 (2)
(2)
where ne is the thermal plasma density in cubic centimetres, B|| is the line-of-sight parallel component of the intervening magnetic field in microgauss, L is the distance between the observer and the source in kiloparsecs, and the RM is in units of radians per square metre.
The RM properties reflect those of the intervening magnetic field and thermal plasma. The RM values associated with a galaxy cluster generally fluctuate on a range of scales, reflecting its turbulent microgauss-level magnetic field. They show a radial profile with a maximum at the cluster centre that decreases outwards. These profiles can be modelled with analytical approaches Lawler & Dennison (1982), Felten (1996) to derive an estimate of the intracluster magnetic field (e.g. Feretti et al. 1999). Numerical tools can improve the modelling and measure the intracluster magnetic fields with good accuracy from the observed RM (e.g. Enßlin & Vogt 2003; Vogt & Enßlin 2003; Murgia et al. 2004). However, the use of advanced numerical tools to estimate large-scale magnetic fields from the RM measurements is not trivial and can require significant computational effort. An important limitation arises from the finite sensitivity and resolution of radio telescopes, which detect a limited number of polarised sources per square degree in a limited number of galaxy clusters, with at most 20 identified to date (Vogt & Enßlin 2003; Murgia et al. 2004; Govoni et al. 2006; Guidetti et al. 2008; Laing et al. 2008; Bonafede et al. 2010; Guidetti et al. 2010; Vacca et al. 2010, 2012; Govoni et al. 2017; Stuardi et al. 2021; Vacca et al. 2022; Pagliotta et al. 2025; De Rubeis et al. 2024; Khadir et al. 2026; Alonso-López et al. 2026). To better understand how intracluster magnetic fields evolve in different environments, under which mechanisms, and their impact on the physics of cluster galaxies, it is of paramount importance to increase the sample.
In a previous work (hereafter L25, Loi et al. 2025) we presented the broadband spectropolarimetric data acquired within the MeerKAT Fornax Survey (MFS; Serra et al. 2023). This is a key survey for the MeerKAT telescope that started observing in 2020 and covers the Fornax cluster and the infalling Fornax A group with 91 pointings. Using broadband data, we reconstructed the densest RM grid ever constructed, with ∼80 polarised sources per square degree (L25). We summarise the main results of L25 in Sect. 2.
In this paper, we use the RM grid to constrain the properties of the Fornax cluster’s magnetic field. Studying the intracluster magnetic field of Fornax is an important step in the investigation of large-scale magnetic fields in clusters for two main reasons. First, Fornax is a low-mass cluster with a virial mass of Mvir = 5 × 10¹³ M⊙ (Drinkwater et al. 2001) and a core radius of ∼173 kpc (Reiprich & Böhringer 2002); as such, it is representative of the majority of the cluster population in the Universe. Second, it is nearby, at a distance of ∼20 Mpc (Blakeslee et al. 2001; Jensen et al. 2001; Tonry et al. 2001) allowing us to study the magnetic field with unprecedented spatial resolution.
In Section 2 we summarise the RM properties reported in detail in L25. In Section 3 we describe the methodology used to derive the intracluster magnetic field, while we present the corresponding results in Section 4. Section 5 discusses the magnetic field properties of the Fornax cluster in the context of a sample of 16 galaxy clusters and groups from the literature. The conclusions are given in Section 6.
Throughout this paper we assume a Λ cold dark matter (ΛCDM) cosmology with H0 = 71 km s−1 Mpc−1, Ωm = 0.27, and ΩΛ = 0.73. At the distance of the Fornax cluster, 1 arcsec corresponds to 0.1 kpc.
2. Rotation measure properties
In L25 we constructed a dense RM grid (∼80 polarised sources/deg2) by applying the RM-synthesis technique (Brentjens & de Bruyn 2005) to the Stokes Q and U cubes with frequencies between 900 MHz and 1.4 GHz, with 5 MHz wide frequency channels and a spatial resolution of 13 arcsec. We identify the Faraday depth at the peak of the Faraday dispersion function as the observed RM.
A comparison between the RM obtained from the RM-synthesis and the one resulting from a λ2-fit of the polarisation angle suggests that the majority of the sources are Faraday simple, i.e. the polarised signal of the sources crosses a completely external Faraday screen.
At these frequencies the observed RM is primarily due to the Fornax cluster and the Galactic foreground. Therefore, we subtracted the Galactic foreground from the observed RM using the 2D polynomial by Anderson et al. (2021).
The main RM features reported in detail in L25 are:
-
a stripe of high-RM (in absolute value) sources crossing the cluster centre from N to SSW with positive and negative values going toward N and SSW, respectively;
-
an RM mean increment at a radial distance of about 300 kpc, rising from zero to ∼5 rad m−2;
-
a ∼13 rad m−2 RM standard deviation plateau at large distances from the cluster centre.
We suggest that the high-RM stripe traces the accretion of matter from the large-scale structure surrounding the system: the Fornax cluster is linked with the Eridanus galaxy group to the north (Raj et al. 2024) and with the Fornax A group to the south-west (da Costa et al. 1988). The Eridanus group lies at a distance on the plane of the sky of around 14 Mpc and at z = 0.00557. Accretion events along the direction connecting the Fornax cluster and the Eridanus and Fornax A group can explain the enhancement of the RM values within the virial radius of the cluster.
The RM increase at about r ∼ 300 kpc is likely due to the magnetic field power spectrum: in the eastern part, sloshing motions cause a decay of the magnetic field energy into small structures, while in the western part the lack of dynamical motions preserves a larger autocorrelation length; the combination of these effects results in a smaller RM in the eastern side compared to the western side of the cluster.
The RM standard deviation plateau at large distances from the cluster centre shows no significant directional dependence. We argue that this reflects a combination of direction-independent contributions that effectively set a noise floor: the RM noise (∼2 rad m−2), the local environment of the sources (∼6 rad m−2), the Milky Way (∼6 rad m−2), and the cosmic web and the Fornax cluster (accounting for the remaining 9−10 rad m−2).
3. Models and methods to measure the Fornax cluster’s magnetic field
This section describes how we constrained the power spectrum, strength, and profile of the magnetic field of the Fornax cluster.
Due to the turbulent nature of the intracluster magnetic field, it is important to consider different realisations of the same magnetic field model and to investigate which distribution has the higher probability of reproducing the data. Several works (see e.g. Govoni et al. 2017) have employed the FARADAY tool in this way using Bayesian inference (Murgia et al. 2004).
The basis of the Bayesian approach is to evaluate the posterior probability distribution P(θ|D) of the model parameters θ given the data D. The posterior probability distribution depends on prior knowledge P(θ) of the model parameters, the likelihood P(D|θ), and the so-called evidence P(D),
 (3)
(3)
where P(D) is defined as the integral of the likelihood function weighted by the prior over the entire parameter space,
 (4)
(4)
The posterior distribution is therefore an indicator of the most probable set of parameters.
We used a Markov chain Monte Carlo (MCMC) method with the Metropolis-Hastings algorithm to generate a sample of the posterior probability distribution without the need to calculate the evidence explicitly. Computing the evidence is difficult because it requires exploring the entire parameter space. The MCMC starts from a parameter set θ0, randomly extracted assuming a Gaussian prior distribution of all parameters within a given range. The algorithm runs for several iterations by selecting new states according to a Q(θ, θ′), a transition kernel between the current and the proposed positions, i.e. θ and θ′. The proposed position is accepted with a probability
![Mathematical equation: $$ \begin{aligned} h = \min \left[1, \frac{P(D|\theta \prime )P(\theta \prime )Q(\theta \prime ,\theta )}{P(D|\theta )P(\theta )Q(\theta ,\theta \prime )}\right]. \end{aligned} $$](/articles/aa/full_html/2026/06/aa59964-26/aa59964-26-eq10.gif) (5)
(5)
The MCMC starts with a number of ‘burn-in’ steps during which the standard deviation of the transition kernel, a multivariate Gaussian kernel in this work, is adjusted so that the average acceptance rate is 50%. We discarded these steps from the accepted values and the posterior distribution consists of the model parameters explored after the burn-in period. We evaluated the final statistics on the model parameters from the posterior distribution.
3.1. Magnetic field power spectrum
The magnetic field power spectrum is related to the RM power spectrum. In our analysis, we assumed a single power–law power spectrum for the magnetic field,
 (6)
(6)
that fluctuates between a minimum and a maximum wave number, kmin and kmax, and zero elsewhere. In physical space, kmin and kmax are referred to as Λmax and Λmin, with Λ = 2π/k.
We used the Bayesian method to determine the best parameters for the assumed magnetic field model. Starting from a set of parameters ζ, A, Λmin and Λmax, the FARADAY tool generates a simulated RM image, assuming proportionality between the 2D RM and the 3D magnetic field power spectra (Enßlin & Vogt 2003). We added the RM noise associated with the data to this image, computed following Sotomayor-Beltran et al. (2013). We included a weight equal to  for the cluster sources (which implies that these sources lie in the cluster midplane). We rescaled the simulated image assuming a β-model distribution (Cavaliere & Fusco-Femiano 1976) for the thermal plasma density,
 (7)
(7)
where n0 is the central plasma density and rc is the cluster core radius. The most recent model we found in the literature for the Fornax cluster reports β = 0.804, rc = 130 kpc and n0 = 1 ⋅ 10−3 cm−3 (Reiprich & Böhringer 2002), where rc and n0 are corrected for the assumed cosmological model. After blanking the simulated image in the same way as the observed RM image, we computed the RM structure function S(dr) and compared it with the observed RM structure function. This is a fundamental diagnostic for estimating the structure of the intracluster magnetic field. It is defined as the average mean square difference in RM values between pixels at a given distance dr,
![Mathematical equation: $$ \begin{aligned} S(dr)=\langle [\mathrm{RM}(r)-\mathrm{RM}(r+dr)]^2\rangle . \end{aligned} $$](/articles/aa/full_html/2026/06/aa59964-26/aa59964-26-eq14.gif) (8)
(8)
The uncertainty associated with the RM structure function is computed by propagating the RM errors,
 (9)
(9)
3.2. Magnetic field strength and trend
Once we constrained the magnetic field power spectrum, we characterised the magnetic field strength using 3D numerical simulations. We assumed a radial profile for the magnetic field strength that scales with the thermal plasma distribution, following a power-law relation,
 (10)
(10)
where B0 is the magnetic field strength at the cluster centre. We normalised each simulated cube assuming a specific value for B0 and η. We then computed the RM by performing the integral in Eq. (2), assuming the β-model for the thermal plasma density reported previously. In this case, we also accounted for the RM noise and the weighting, and we blanked the images as in the observed RM image. As already discussed, at large distances from the cluster centre, the RM standard deviation tends to a value of ∼13 rad m−2 due to several contributions (noise, local environment, Milky Way, large-scale structure, and the Fornax cluster). We included this additional factor in the simulations. We compared the RM standard deviation radial profile with the observed profile using the Bayesian approach described at the beginning of this section.
4. Results
To constrain the magnetic field properties, we considered a field of view of 1.4° (∼512 kpc) centred on the cluster centre. This choice reduces the contamination of the estimate by the thermal plasma asymmetry (Su et al. 2017; Reiprich et al. 2025), for which we do not have an accurate mode;. It also reduces contamination by the RM increment observed at a distance of about 300 kpc from the cluster centre.
4.1. 2D simulations
We computed the RM structure function by considering separations between pixels up to a maximum distance of 64 kpc to be less sensitive to variations in the density profile. We explored a parameter space with slope ζ ranging from 0 to 5, for the minimum scale Λmin from 0.5 (i.e. twice the pixel size) to 2.2 kpc, and for the maximum scale Λmax from 2.5 to 230 kpc. We chose these scale limits according to the physical fluctuations that our data can probe, i.e. from half of the beam size to half of the field of view. We also tested a broken power law to model the magnetic field power spectrum. The results are consistent with those reported below, except for the emergence of a strong degeneracy between the parameters. Indeed, a higher value of the maximum scale Λmax forces the power law to be steeper to preserve the total power. The broken power law collapses into a single power law since at Λmin there is little contribution to the total power.
Fig. 1 shows the results. The upper-left panel displays the RM structure function models obtained from our simulations. The blue points show the measured RM structure function. After a steep and continuous increase, the function oscillates around 1000 rad2 m−4 starting from dr = 6 kpc. Beyond dr ≈ 30 kpc, the mean value of the structure function decreases to around 700 rad2 m−4.
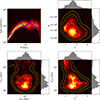 |
Fig. 1. Magnetic field power spectrum measurements. Top left: Comparison between the observed(blue points) and simulated RM structure functions. Top right, bottom left, and bottom right: Posterior distributions of normalisation vs slope, maximum vs minimum scales, and maximum scale vs slope, respectively. The last three panels show histograms of each parameter. The contours show the 1, 2, and 3σ levels associated with the distributions. |
At the 68 per cent confidence level, our modelling suggests a power-law power spectrum for the Fornax cluster’s magnetic field with a slope of  , a minimum physical scale
  ) kpc, a maximum physical scale
  ) kpc, and a normalisation of 2990
 μG2. These scales correspond to kmax = 6.2 ± 1 kpc−1 and
  kpc−1, respectively.
We computed the magnetic field autocorrelation length using the best-fit parameters for the magnetic field power-law power spectrum using the following equation (Enßlin & Vogt 2003):
 (11)
(11)
which yields ΛB = (3.3 ) kpc.
4.2. 3D simulations
We determined the central strength and the power–law exponent of the Fornax cluster’s magnetic field by considering the RM standard deviation profile. We computed this profile on the image plane in 50 kpc wide concentric annuli. We explored the parameter space between 0.01 and 50 μG for B0 and between −0.5 and 3 for η.
The right panel of Fig. 2 shows the posterior probability distribution of B0 and η, while the left panel displays the comparison between the simulated and observed RM standard deviation radial profiles.
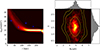 |
Fig. 2. Magnetic field profile measurements. Left: Comparison between the observed RM standard deviation profile (blue points) and the distribution of simulated profiles. Right: Posterior distribution of the central strength and slope of the magnetic field profile. |
The best realisations of the magnetic field have a central strength of (5.0 ) μG, decreasing with the thermal plasma density with a slope of η = (1.6
 ). The observed RM standard deviation profile does not exhibit the monotonic radial decrease displayed by the simulated profiles. This behaviour has been observed in several cases, such as in 3C31, Hydra A (Laing et al. 2008), the Coma cluster (Bonafede et al. 2010), 3C449 (Guidetti et al. 2010) A2345 (Stuardi et al. 2021), and A194 (Govoni et al. 2017). For A194, the fluctuations are likely due to the smaller size of the central annulus compared to the outer annuli, leading to an undersampling of the RM distribution. Notably, simulations reproduce the observed behaviour in A194. In our study, the second radial bin is the least populated due to noise limitations (see Appendix B in L25), with 81, 15, 49, 96, and 82 independent measurements from the first to the last radial bin, respectively. Even with only 15 measurements, as in our most limited bin, we verified that the standard deviation of a Gaussian distribution can be correctly inferred through random extraction. Therefore, the number of sources in each bin is sufficient to represent the RM statistics, which explains why simulations cannot replicate the observed fluctuations. To test whether noise contributes to this effect, we applied a more stringent RM detection threshold, considering only measurements with an associated error smaller than 2 rad m−2 (corresponding to polarised S/N > 13). The RM standard deviation values differ by about 1 rad m−2 compared to those in Fig. 2, except in the second radial bin, where the value is 5 rad m−2 lower. Even in this case, the number of independent measurements per bin remains significant (71, 7, 19, 46, and 40 from the central to outer bins), although we observe a roughly 50% depletion starting from the second bin outward.
Observational effects that we have not accounted for may contribute to the observed scatter. However, numerical simulations (Rappaz et al. 2024; Loi et al. 2019) show that the RM standard deviation radial profile can exhibit intrinsic scatter, particularly when the observations resolve the magnetic field fluctuation scale (see Appendix A in Rappaz et al. 2024). Such simulations incorporate more realistic models of the magnetic field structure and thermal plasma distribution, which could explain the variations in the RM structure function.
Considering that our simulations rely on simple models for the RM that, for instance, cannot reproduce the observed thermal plasma asymmetry, we find the results presented in Fig. 2 to be satisfactory.
5. Comparison with the literature and discussion
This paper presents the first accurate measurement of the Fornax cluster’s magnetic field. We note that the magnetic field strength derived in this work is consistent with the 10 μG upper limit established by Su et al. (2017), which is based on the modelling of a candidate Kelvin–Helmholtz instability eddy detected 3 kpc from the cluster centre. To better understand the implications of our findings for overall cluster physics, we performed a qualitative comparison with the properties of magnetic fields measured in galaxy clusters and groups.
Table A.1 summarises the magnetic field estimates available in the literature, derived from spectropolarimetric modelling of cluster diffuse sources (A523 and A665) or RM analysis (the remaining systems) using various numerical tools and assumptions. Magnetic field parameters that were fixed a priori in the original modelling are marked with an asterisk. We rescaled all values to the cosmological model adopted in this study. This collection encompasses galaxy clusters and groups in diverse dynamical states. Massive relaxed clusters are the end products of low-mass systems that have accreted mass through numerous merging events. These events are thought to drive the amplification of intracluster magnetic fields on gigayear timescales (see e.g. Subramanian et al. 2006), a duration that corresponds to the typical relaxation period of galaxy clusters (Zhang et al. 2022). For our analysis, it is crucial to distinguish between merging and relaxed clusters. In the latter case, we expect higher magnetic field strengths and a smaller autocorrelation length, as magnetic energy cascades from large injection scales down to smaller scales. Conversely, minor mergers and radio activity promoted by cluster active galactic nuclei (AGNs) can induce instabilities that amplify magnetic fields more rapidly (Domínguez-Fernández et al. 2019). The presence of extended central radio galaxies is highlighted throughout our discussion of the results. At lower masses (∼1013 M⊙), the magnetisation process remains poorly understood. Such systems are characterised by smaller sizes and lower thermal densities, which implies: (a) potential departures from the magnetohydrodynamical (MHD) approach used in cosmological numerical simulations due to the collisionless nature of the thermal plasma (Simionescu et al. 2019), and (b) a more prominent role of AGN feedback (see e.g. Eckert et al. 2021). To investigate whether and how magnetic field properties reflect the dynamical state of the systems, their physics, and the role of central powerful radio sources, we adopt the following categories:
-
Massive merging clusters (MMC) and massive relaxed clusters (MRC) for systems with masses within R5001M500 > 1014 M⊙;
-
Low-mass merging clusters (LMC) and low-mass relaxed clusters (LRC) for systems with M500 < 1014 M⊙;
-
Galaxy groups (GG) based on existing literature classification.
We adopted the M500 and R500 values from the meta-catalogue of X–ray detected clusters of galaxies (MCXC; Piffaretti et al. 2011). The Fornax cluster presents an intermediate dynamical state, as it is a moderate cool-core cluster undergoing a merging with the Fornax A group. Our analysis is limited to the central part of the cluster, where X-ray observations show no evidence of merger-induced shock waves. Consequently, we classify it as an LRC. In the following sections, we discuss the main properties of the sample reported in Table A.1, which comprises 17 galaxy clusters and groups.
5.1. The shape of the magnetic field power spectrum
Fig. 3 illustrates the magnetic field power spectra for our sample, plotted using the minimum and maximum fluctuation scales inferred in each study. We include only those measurements obtained without a priori assumptions regarding the power-spectrum slope.
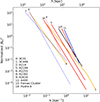 |
Fig. 3. Normalized magnetic field power spectra. Blue, red, and orange lines correspond to merging galaxy clusters, relaxed galaxy clusters, and galaxy groups, respectively; solid and dotted lines are used for systems with or without central extended radio galaxies. The Fornax cluster is represented by a solid black line. |
A2382 shows a Kolmogorov-like spectrum. Vogt & Enßlin (2003) found consistent values for A2634 and A400. In contrast, we find ζ ≈ 2 for A119 and 3C449, ζ ≈ 2.7 for 3C31, ζ ≈ 2.7 for Hydra A, the Fornax cluster, and A2199, and ζ ≈ 3 for A2255. Magnetohydrodynamic (MHD) simulations incorporating AGN feedback (see Tevlin et al. 2025) typically show a Kolmogorov spectrum at small scales (≤100 kpc), while at large scales (≥100 kpc) a k−1/2 Kazantsev trend emerges due to dynamo activity. Consequently, the observed deviations from a Kolmogorov spectrum may represent a compromise between these two regimes–leading to a flatter overall spectrum–or they may highlight the resolution limits of current MHD simulations. Indeed, accurately reconstructing galaxy cluster physics from the smallest scales (e.g. supernova-driven turbulence) to the largest scales (above a few megaparsecs) remains computationally challenging. The former scenario might apply to A119 and A2255. However, in the case of A2255, we derived the power spectrum by fixing the maximum scale of fluctuation to 512 kpc. Adopting smaller or larger values would result in a flatter or steeper spectrum, respectively. In most other cases, the large scales are not sufficiently sampled. As discussed in Section 4 for the Fornax cluster, a broken power-law model, which in principle could probe both trends, effectively collapses into a single power-law. Alternatively, the magnetic field in these systems may not yet have reached the saturation phase (Schekochihin et al. 2004). This would challenge recent theoretical results suggesting that saturation is achieved as early as z ≈ 4 (Tevlin et al. 2025). We acknowledge the strong degeneracy between the power spectrum parameters, the inherent simplicity of our assumed models, and possible bias due to the comparison of results derived using different approaches. Nevertheless, these results underscore the complex physics governing these environments, which can shape the magnetic field power spectrum and cause a flattening relative to the Kolmogorov expectation. This suggests that more power is injected at small scales than is currently predicted by state-of-the-art simulations and/or that the magnetic field is still undergoing active amplification.
We examined the magnetic-field autocorrelation lengths ΛB, which are expected to reflect the characteristic turbulence scales of the ICM. In Fig. 4, we plot this quantity as a function of cluster mass. Massive merging clusters consistently exhibit larger autocorrelation lengths compared to massive relaxed systems, regardless of the overall cluster mass. This difference likely arises because, in relaxed clusters, the magnetic field energy has had sufficient time to cascade from large injection scales down to smaller scales, as previously noted by Vacca et al. (2026). Interestingly, low-mass galaxy clusters and groups display autocorrelation lengths similar to those of massive relaxed clusters. Even lower values are observed in the Fornax cluster and the merging low-mass cluster A400. Notably, both of these systems host an extended central radio galaxy, which could be responsible for more rapid and localised magnetic field amplification at small scales. This mechanism will be discussed in further detail in the following section.
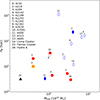 |
Fig. 4. Magnetic field autocorrelation length as a function of M500, colour-coded as in Fig. 3. Diamonds, circles, and squares show merging clusters, relaxed clusters, and galaxy groups, respectively. The Fornax cluster measurement is shown as a black triangle. Filled symbols indicate which systems host an extended radio galaxy at the centre. |
5.2. Magnetic field values and profiles
Fig. 5 shows the magnetic-field central strength as a function of central plasma density. Using a linear fit in the log–log plane, we find a scaling relation of B0 ∝ n0(0.38 ± 0.14). The fit uncertainties, derived by propagating the errors on the fit parameters, are indicated by the shaded grey area. This plot represents an update to the results reported by Govoni et al. (2017) and Vacca et al. (2026); unlike those studies, we include measurements of A400, A2634, A2345, A2142, A3581, and the Fornax cluster, while the latter work also includes A665 and A523. Govoni et al. (2017) and Vacca et al. (2026) find B0 ∝ n00.47 and B0 = n0(0.56 ± 0.17), respectively. Our flatter correlation remains consistent with these previous works within the uncertainties.
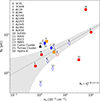 |
Fig. 5. Magnetic field central strength as a function of central thermal density, using the same colour and symbol code described in Fig. 4. The dashed line represents the best-fit model (parameters shown in the bottom-right corner), with uncertainties indicated by the shaded grey area. |
Notably, our target exhibits a central magnetic field strength approximately twice as high as predicted by the fitted correlation. Similar excesses are observed in Hydra A, 3C31, A400, and A119, whereas A665, A523, and A3581 are characterised by lower values. A key distinction among these systems is the presence of one or more extended radio sources at the centre of the first group, with the exception of A119.
To further investigate this, Fig. 6 shows the magnetic field radial profile as a function of the ratio between the distance from the cluster centre and R500. We find that the Fornax cluster exhibits the steepest radial profile among all systems considered in this study, suggesting that an efficient magnetic-field amplification mechanism operates near the cluster centre. Magnetohydrodynamic (MHD) simulations demonstrate that cold fronts can significantly enhance magnetic fields along the boundaries of sloshing regions, thereby steepening the radial profile (e.g. ZuHone et al. 2011). Indeed, a series of cold fronts induced by the infall of NGC 1404 has been detected in Fornax at radii of approximately 3, 11, 32, and 220 kpc (Su et al. 2017, converted in our cosmology). These are indicated in Fig. 6 by vertical grey shaded areas. However, while the magnetic field strength remains high in the inner regions, it drops to 10% of its central value at 220 kpc. This decline suggests that additional mechanisms may contribute to the amplification of the intracluster magnetic field.
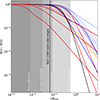 |
Fig. 6. Normalized magnetic-field strength profiles as a function of the ratio between the distance from the cluster centre and R500. The line styles are consistent with those in Fig. 3. The shaded grey areas indicate the location of the cold front detected by Su et al. (2017), while the vertical black line shows the extension of the radio lobes associated with NGC 1399. |
The central AGN activity, which has produced two lobes extending up to ∼25 kpc, could be a driver of recent re-amplification. In low-density environments such as the ICM of Fornax, AGN outbursts can efficiently amplify magnetic fields through shocks generated by the inflation of radio bubbles (see e.g. Donnert et al. 2018, and reference therein). The observed steep profile and the high central strength can thus be explained by the interaction between the extended central radio source and the surrounding ICM. This interpretation is supported by the chronology of events: AGN activity is more recent than the sloshing episode. The symmetry of the two radio lobes implies that their inflation occurred late in the cluster’s evolution; otherwise, sloshing would have significantly distorted the radio morphology (Domínguez-Fernández et al. 2024). Moreover, Su et al. (2017) estimate that the sloshing age is of the order of a gigayear, far exceeding the typical radiative lifetime of AGNs.
Simulations by Domínguez-Fernández et al. (2024), combining binary cluster mergers with bidirectional central jet injection, strengthen this scenario. At early stages (see Fig. 5 in that paper), when the AGN is active but before the merger has disrupted the system, the central magnetic field strength exceeds the overall trend observed once sloshing has mixed the radio lobes with the ICM. These results point to AGN-driven amplification as the origin of the steep profile in Fornax. This factor, combined with pre-amplification by sloshing motions, likely explains the cluster’s relatively high central magnetic field strength.
Before this work, the steepest reported power-law exponent was η ≈ 1.1, measured in the low-mass cluster A194. Similar to Fornax, A194 hosts a central AGN with symmetric jets and has a relatively low central density; however, unlike our target, it lacks evidence of cluster mergers or cold fronts. In that case, AGN outbursts likely dominate the central magnetic field amplification. Furthermore, the most prominent departures from the correlation in Fig. 5 are consistent with our proposed interpretation: higher central strengths are found in systems hosting one or more extended radio sources. A notable exception is A119; however, as reported by Watson et al. (2023), it is characterised by recent and on-going merger activity, which could justify the observed magnetic field amplification across the cluster volume and the resulting flat radio profile.
Among the systems that fall below the B0 − n0 correlation, A3581 stands out as an unexpected outlier. Given its relaxed dynamical state, one would expect a central magnetic field strength of the order of tens of microgauss. The lower value reported by Khadir et al. (2026) may result from the decision to constrain the power-law exponent parameter (η) to values below 0.5. Although this was motivated by the observed flattening of the RM profile, Table A.1 shows that other relaxed systems are well-described by profiles with η = 1. Adopting this higher value would increase the central strength to ≈37 μG, bringing A3581 into alignment with the other upper outliers.
A similar discrepancy may affect A665 (Vacca et al. 2010), for which η was derived from the radio halo surface brightness radial profile under the assumption of equipartition between the magnetic field and relativistic particles. This assumption implies a steep scaling between radio emissivity Jν and the magnetic field (Jν ∝ B4), leading to the profile Jν ∝ (1 + (r/rc)2)−6βη (assuming Eq. 10). However, since the equipartition condition is physically difficult to achieve, a scaling of Jν ∝ B2 may be more plausible and η would be ≈1, yielding B0 ≈ 3 μG, consistent with the established B0 − n0 correlation. The final outlier in the low-B0 regime is A523. The model reported by (Vacca et al. 2022) was specifically designed to demonstrate that an intracluster magnetic field can generate polarised radio halo emission on scales exceeding those of the associated total intensity. Because the primary objective was to reproduce these polarised structures, the (B0, η) parameter space was not explored in detail. Consequently, this measurement likely suffers from the same modelling biases discussed above, where a different choice of η could bring the cluster into better agreement with the B0 − n0 correlation. It is important to note that the correlation presented by Vacca et al. (2026) remains statistically consistent with the measurements for A665 and A523 within their reported uncertainties. While models utilising a curved power spectrum could introduce systematic offsets, our primary conclusions remain robust even if we exclude A2142 and A2345.
Our results establish a crucial benchmark for cluster magnetisation, yet they also reveal that a consistent and homogeneous modelling strategy is required across the literature to ensure statistically robust and bias-free comparisons between different environments.
Osinga et al. (2025) recently conducted a more quantitative study of magnetic field properties in galaxy clusters. Through a statistical analysis of 124 massive Planck clusters at low redshift (z < 0.35) using depolarisation and RM stacking techniques, they find that the best–fit RM standard deviation profiles are obtained with η < 0.5. However, they also note that more advanced modelling of the intracluster magnetic field is required to further refine this comparison. Furthermore, they report flatter RM profiles in cool-core clusters compared to non-cool-core systems. Since Fornax is a moderate cool-core cluster, it would be expected to exhibit a relatively flat profile. The fact that this is not observed suggests that magnetic field amplification and distribution in clusters depend strongly on their dynamical state, mass, and density, as well as the presence of powerful AGNs.
In addition, we note that the timescales of merging events and AGN outburst cycles differ significantly, spanning gigayears versus tens or hundreds of megayears, respectively. While widespread magnetic field amplification occurs slowly via turbulence induced by merging events, more rapid and localised amplification is expected when a central AGN is radio active (Domínguez-Fernández et al. 2019). Indeed, flat profiles (η < 0.5) are found in systems forming the Shapley Supercluster core (Alonso-López et al. 2026), which consists of two massive galaxy clusters connected by an intracluster bridge detected with Planck (Planck Collaboration XXII 2016) and incorporates two massive groups of galaxies. This system is characterised by large-scale diffuse radio emission (Venturi et al. 2022), a clear tracer of an ongoing merger event. Finally, we note that the correlation found by Balboni et al. (2025) between the magnetic field and the galaxy cluster mass (B ∝ Mb, with b ≈ 2) describes only A2255 and the Coma cluster within our sample, at least within the uncertainties. This is perhaps unsurprising, as the correlation was derived from a sample of 18 massive galaxy clusters (M500 ≥ 2.6 ⋅ 1014 M⊙) hosting diffuse radio sources. This discrepancy further highlights the need for deeper investigations of the complex physics at play in the different environments that characterise both galaxy groups and clusters.
6. Conclusions
We present the first detailed measurements of the Fornax cluster’s magnetic field, out to a radius of about 260 kpc (∼0.37 × Rvir), together with a qualitative discussion of magnetisation across a sample of 17 galaxy clusters and groups. Exploiting the dense RM grid provided by the MeerKAT Fornax Survey, we reconstructed the properties of the intracluster magnetic field by comparing observed RM data with numerical simulations using a Bayesian approach. To avoid potential contamination from the evident asymmetry in the X-ray distribution, for which an accurate reconstruction is currently unavailable, we restricted the RM measurements to within 250 kpc of the cluster centre. We modelled the power spectrum with a power law, finding a slope of 2.7 and a minimum and a maximum scale of 1.01
 and 15
 kpc, respectively. The resulting magnetic field autocorrelation length is
  kpc. By assuming that the magnetic field scales radially with the thermal plasma density, we constrained its central strength to 5.0
 μG and derived a steep a power-law exponent of
  . Compared to other clusters in the literature, Fornax exhibits a remarkably steep magnetic field radial profile and a relatively high central strength.
Our qualitative analysis of 17 systems studied via RM in the literature reveals that, in agreement with previous work, massive merging clusters generally host larger autocorrelation lengths (Fig. 4). Conversely, massive relaxed clusters and low-mass clusters and galaxy groups are characterised by smaller auto-correlation lengths. Notably, among the ten systems with an inferred power spectrum slope, only three exhibit a Kolmogorov spectrum, while the remainder show a flatter behaviour (Fig. 3). These findings suggest that state-of-the art numerical simulations may still lack magnetic field power on kiloparsec scales or that the magnetic field is still undergoing amplification. At the cluster centre, the sample follows the relation B0 ∝ n0(0.38 ± 0.14) (Fig. 5), consistent within the uncertainties with previous studies (e.g. Govoni et al. 2017; Vacca et al. 2026); however, several systems, including Fornax, display magnetic field strengths approximately twice as high as predicted by this correlation.
Since Fornax is a low-mass environment hosting a radio-loud central brightest cluster galaxy (BCG), we conclude that the amplification of its intracluster magnetic field likely stems from a combination of sloshing-induced turbulence and, more recently, radio-galaxy activity. This interpretation is supported by the steep radial slope of the magnetic field profile (Fig. 6). Furthermore, four of the five upper outliers in the B0 − n0 correlation, namely Hydra A, A400, 3C31, and the Fornax cluster, host one or more extended radio galaxies at their centres. Their interaction with the environment may have enhanced the magnetic-field amplification at small scales, as evidenced by the small autocorrelation lengths observed in these systems (see Fig. 4).
This study advances our understanding of cosmic magnetism and sheds light on the amplification mechanisms operating across diverse large-scale environments. Future systematic surveys with SKA precursors and pathfinders, and eventually with the SKA-Mid telescope (Loi et al. 2026), will be essential to clarify how dynamical state, mass, density, and AGN feedback shape the observed magnetic fields and influence the evolution of cluster-embedded galaxies.
Acknowledgments
The authors thank the anonymous referee for their helpful comments that improved the manuscript. We are grateful to the full MeerKAT team for their work building, commissioning and operating MeerKAT, and for their support to the MeerKAT Fornax Survey. The MeerKAT telescope is operated by the South African Radio Astronomy Observatory, which is a facility of the National Research Foundation, an agency of the Department of Science and Innovation. We acknowledge support from MAEC grant nr ZA23GR03 (RADIOMAP). This project has received funding from the European Research Council (ERC) under the European Union’s Horizon 2020 research and innovation programme (grant agreement no. 679627, “FORNAX”; and grant agreement no. 882793, “MeerGas”). The data of the MeerKAT Fornax Survey are reduced using the CARACal pipeline, partially supported by ERC Starting grant number 679627, MAECI Grant Number ZA18GR02, DST-NRF Grant Number 113121 as part of the ISARP Joint Research Scheme, and BMBF project 05A17PC2 for D-MeerKAT. Information about CARACal can be obtained online under the URL: https://caracal.readthedocs.io. The INAF – OAC computer cluster used in this work has been acquired within a project aimed to enhance the Sardinia Radio Telescope (SRT). The Enhancement of the SRT for the study of the Universe at high radio frequencies is financially supported by the National Operative Program (Programma Operativo Nazionale – PON) of the Italian Ministry of University and Research “Research and Innovation 2014-2020”, Notice D.D. 424 of 28/02/2018 for the granting of funding aimed at strengthening research infrastructures, in implementation of the Action II.1 – Project Proposal PIR01_00010. This work was carried out thanks to the funding of the Regione Autonoma della Sardegna, ai sensi della Legge Regionale 7 agosto 2007, n.7 “Promozione della Ricerca Scientifica e dell’Innovazione Tecnologica in Sardegna”. FL acknowledges financial support from the Italian Ministry of University and Research – Project Proposal CIR01-00010. VV acknowledges support from the Premio per Giovani Ricercatori “Gianni Tofani” II edizione, promoted by INAF-Osservatorio Astrofisico di Arcetri (DD n. 84/2023). PK is partially supported by the BMBF project 05A23PC1 for D-MeerKAT III. FMM carried out part of the research activities described in this paper with contribution of the Next Generation EU funds within the National Recovery and Resilience Plan (PNRR), Mission 4 – Education and Research, Component 2 – From Research to Business (M4C2), Investment Line 3.1 – Strengthening and creation of Research Infrastructures, Project IR0000034 – “STILES – Strengthening the Italian Leadership in ELT and SKA”. This work is based on data from eROSITA, the soft X-ray instrument aboard SRG, a joint Russian-German science mission supported by the Russian Space Agency (Roskosmos), in the interests of the Russian Academy of Sciences represented by its Space Research Institute (IKI), and the Deutsches Zentrum für Luft- und Raumfahrt (DLR). The SRG spacecraft was built by Lavochkin Association (NPOL) and its subcontractors, and is operated by NPOL with support from the Max Planck Institute for Extraterrestrial Physics (MPE). The development and construction of the eROSITA X-ray instrument was led by MPE, with contributions from the Dr. Karl Remeis Observatory Bamberg & ECAP (FAU Erlangen-Nuernberg), the University of Hamburg Observatory, the Leibniz Institute for Astrophysics Potsdam (AIP), and the Institute for Astronomy and Astrophysics of the University of Tübingen, with the support of DLR and the Max Planck Society. The Argelander Institute for Astronomy of the University of Bonn and the Ludwig Maximilians Universität Munich also participated in the science preparation for eROSITA. The eROSITA data shown here were processed using the eSASS software system developed by the German eROSITA consortium.
References
- Alonso-López, D., O’Sullivan, S. P., Bonafede, A., et al. 2026, A&A, 705, A143 [NASA ADS] [CrossRef] [EDP Sciences] [Google Scholar]
- Anderson, C. S., Heald, G. H., Eilek, J. A., et al. 2021, PASA, 38, e020 [NASA ADS] [CrossRef] [Google Scholar]
- Balboni, M., Ettori, S., Gastaldello, F., et al. 2025, A&A, 695, A180 [NASA ADS] [CrossRef] [EDP Sciences] [Google Scholar]
- Blakeslee, J. P., Lucey, J. R., Barris, B. J., Hudson, M. J., & Tonry, J. L. 2001, MNRAS, 327, 1004 [NASA ADS] [CrossRef] [Google Scholar]
- Bonafede, A., Feretti, L., Murgia, M., et al. 2010, A&A, 513, A30 [NASA ADS] [CrossRef] [EDP Sciences] [Google Scholar]
- Brentjens, M. A., & de Bruyn, A. G. 2005, A&A, 441, 1217 [NASA ADS] [CrossRef] [EDP Sciences] [Google Scholar]
- Cavaliere, A., & Fusco-Femiano, R. 1976, A&A, 49, 137 [NASA ADS] [Google Scholar]
- Cova, F., Gastaldello, F., Wik, D. R., et al. 2019, A&A, 628, A83 [NASA ADS] [CrossRef] [EDP Sciences] [Google Scholar]
- da Costa, L. N., Pellegrini, P. S., Sargent, W. L. W., et al. 1988, ApJ, 327, 544 [NASA ADS] [CrossRef] [Google Scholar]
- De Rubeis, E., Stuardi, C., Bonafede, A., et al. 2024, A&A, 691, A23 [NASA ADS] [CrossRef] [EDP Sciences] [Google Scholar]
- Domínguez-Fernández, P., Vazza, F., Brüggen, M., & Brunetti, G. 2019, MNRAS, 486, 623 [Google Scholar]
- Domínguez-Fernández, P., ZuHone, J., Weinberger, R., et al. 2024, ApJ, 977, 221 [CrossRef] [Google Scholar]
- Donnert, J., Vazza, F., Brüggen, M., & ZuHone, J. 2018, Space Sci. Rev., 214, 122 [Google Scholar]
- Drinkwater, M. J., Gregg, M. D., & Colless, M. 2001, ApJ, 548, L139 [Google Scholar]
- Eckert, D., Gaspari, M., Gastaldello, F., Le Brun, A. M. C., & O’Sullivan, E. 2021, Universe, 7, 142 [NASA ADS] [CrossRef] [Google Scholar]
- Enßlin, T. A., & Vogt, C. 2003, A&A, 401, 835 [NASA ADS] [CrossRef] [EDP Sciences] [Google Scholar]
- Felten, J. E. 1996, ASP Conf. Ser., 88, 271 [NASA ADS] [Google Scholar]
- Feretti, L., Dallacasa, D., Govoni, F., et al. 1999, A&A, 344, 472 [NASA ADS] [Google Scholar]
- Ghirardini, V., Eckert, D., Ettori, S., et al. 2019, A&A, 621, A41 [NASA ADS] [CrossRef] [EDP Sciences] [Google Scholar]
- Govoni, F., Murgia, M., Feretti, L., et al. 2006, A&A, 460, 425 [NASA ADS] [CrossRef] [EDP Sciences] [Google Scholar]
- Govoni, F., Murgia, M., Vacca, V., et al. 2017, A&A, 603, A122 [NASA ADS] [CrossRef] [EDP Sciences] [Google Scholar]
- Guidetti, D., Murgia, M., Govoni, F., et al. 2008, A&A, 483, 699 [NASA ADS] [CrossRef] [EDP Sciences] [Google Scholar]
- Guidetti, D., Laing, R. A., Murgia, M., et al. 2010, A&A, 514, A50 [NASA ADS] [CrossRef] [EDP Sciences] [Google Scholar]
- Jensen, J. B., Tonry, J. L., Thompson, R. I., et al. 2001, ApJ, 550, 503 [Google Scholar]
- Khadir, A., Osinga, E., Lee, W., et al. 2026, ApJ, 997, 214 [Google Scholar]
- Laing, R. A., Bridle, A. H., Parma, P., & Murgia, M. 2008, MNRAS, 391, 521 [NASA ADS] [CrossRef] [Google Scholar]
- Lawler, J. M., & Dennison, B. 1982, ApJ, 252, 81 [NASA ADS] [CrossRef] [Google Scholar]
- Loi, F., Murgia, M., Govoni, F., et al. 2019, MNRAS, 490, 4841 [NASA ADS] [CrossRef] [Google Scholar]
- Loi, F., Serra, P., Murgia, M., et al. 2025, A&A, 694, A125 [NASA ADS] [CrossRef] [EDP Sciences] [Google Scholar]
- Loi, F. et al. 2026, In Advancing Astrophysics with the SKA– II (AASKAII). AASKAII/115 [Google Scholar]
- Müller, A., Pfrommer, C., Ignesti, A., et al. 2021, MNRAS, 508, 5326 [CrossRef] [Google Scholar]
- Murgia, M., Govoni, F., Feretti, L., et al. 2004, A&A, 424, 429 [NASA ADS] [CrossRef] [EDP Sciences] [Google Scholar]
- Norseth, C., Wik, D. R., Sarazin, C. L., Sun, M., & Gastaldello, F. 2025, ApJ, 992, 62 [Google Scholar]
- Osinga, E., van Weeren, R. J., Rudnick, L., et al. 2025, A&A, 694, A44 [NASA ADS] [CrossRef] [EDP Sciences] [Google Scholar]
- Pagliotta, A., Riseley, C. J., Bonafede, A., Stuardi, C., & Loi, F. 2025, A&A, 700, A139 [NASA ADS] [CrossRef] [EDP Sciences] [Google Scholar]
- Pfrommer, C., Pakmor, R., Schaal, K., Simpson, C. M., & Springel, V. 2017, AIP Conf. Ser., 1792, 030003 [Google Scholar]
- Piffaretti, R., Arnaud, M., Pratt, G. W., Pointecouteau, E., & Melin, J. B. 2011, A&A, 534, A109 [NASA ADS] [CrossRef] [EDP Sciences] [Google Scholar]
- Planck Collaboration XXII. 2016, A&A, 594, A22 [NASA ADS] [CrossRef] [EDP Sciences] [Google Scholar]
- Raj, M. A., Awad, P., Peletier, R. F., et al. 2024, A&A, 690, A92 [NASA ADS] [CrossRef] [EDP Sciences] [Google Scholar]
- Rappaz, Y., Schober, J., Bendre, A. B., Seta, A., & Federrath, C. 2024, A&A, 691, A132 [NASA ADS] [CrossRef] [EDP Sciences] [Google Scholar]
- Reiprich, T. H., & Böhringer, H. 2002, ApJ, 567, 716 [Google Scholar]
- Reiprich, T. H., Veronica, A., Pacaud, F., et al. 2025, A&A, 703, A9 [NASA ADS] [CrossRef] [EDP Sciences] [Google Scholar]
- Ruszkowski, M., & Oh, S. P. 2010, ApJ, 713, 1332 [NASA ADS] [CrossRef] [Google Scholar]
- Schekochihin, A. A., Cowley, S. C., Taylor, S. F., Maron, J. L., & McWilliams, J. C. 2004, ApJ, 612, 276 [NASA ADS] [CrossRef] [Google Scholar]
- Serra, P., Maccagni, F. M., Kleiner, D., et al. 2023, A&A, 673, A146 [NASA ADS] [CrossRef] [EDP Sciences] [Google Scholar]
- Simionescu, A., ZuHone, J., Zhuravleva, I., et al. 2019, Space Sci. Rev., 215, 24 [NASA ADS] [CrossRef] [Google Scholar]
- Sotomayor-Beltran, C., Sobey, C., Hessels, J. W. T., et al. 2013, A&A, 552, A58 [NASA ADS] [CrossRef] [EDP Sciences] [Google Scholar]
- Stuardi, C., Bonafede, A., Lovisari, L., et al. 2021, MNRAS, 502, 2518 [NASA ADS] [CrossRef] [Google Scholar]
- Su, Y., Nulsen, P. E. J., Kraft, R. P., et al. 2017, ApJ, 851, 69 [Google Scholar]
- Subramanian, K., Shukurov, A., & Haugen, N. E. L. 2006, MNRAS, 366, 1437 [CrossRef] [Google Scholar]
- Tevlin, L., Berlok, T., Pfrommer, C., et al. 2025, A&A, 701, A114 [NASA ADS] [CrossRef] [EDP Sciences] [Google Scholar]
- Tonry, J. L., Dressler, A., Blakeslee, J. P., et al. 2001, ApJ, 546, 681 [Google Scholar]
- Vacca, V., Murgia, M., Govoni, F., et al. 2010, A&A, 514, A71 [CrossRef] [EDP Sciences] [Google Scholar]
- Vacca, V., Murgia, M., Govoni, F., et al. 2012, A&A, 540, A38 [NASA ADS] [CrossRef] [EDP Sciences] [Google Scholar]
- Vacca, V., Govoni, F., Murgia, M., et al. 2022, MNRAS, 514, 4969 [NASA ADS] [CrossRef] [Google Scholar]
- Vacca, et al. 2026, Advancing Astrophysics with the SKA – II (AASKAII). AASKAII/12 [Google Scholar]
- van Weeren, R. J., de Gasperin, F., Akamatsu, H., et al. 2019, Space Sci. Rev., 215, 16 [Google Scholar]
- Venturi, T., Giacintucci, S., Merluzzi, P., et al. 2022, A&A, 660, A81 [NASA ADS] [CrossRef] [EDP Sciences] [Google Scholar]
- Vogt, C., & Enßlin, T. A. 2003, A&A, 412, 373 [NASA ADS] [CrossRef] [EDP Sciences] [Google Scholar]
- Watson, C. B., Blanton, E. L., Randall, S. W., et al. 2023, ApJ, 955, 103 [Google Scholar]
- Zhang, B., Cui, W., Wang, Y., Dave, R., & De Petris, M. 2022, MNRAS, 516, 26 [NASA ADS] [CrossRef] [Google Scholar]
- ZuHone, J. A., Markevitch, M., & Lee, D. 2011, ApJ, 743, 16 [Google Scholar]
R500 is the radius of a spherical region within a galaxy cluster that has a mean density of 500 times the critical density of the universe at the cluster’s redshift.
Appendix A: List of magnetic field measurements
List of magnetic field measurements in galaxy clusters and groups derived from spectro-polarimetric modelling of cluster diffuse sources or RM analysis.
All Tables
List of magnetic field measurements in galaxy clusters and groups derived from spectro-polarimetric modelling of cluster diffuse sources or RM analysis.
All Figures
|
Fig. 1. Magnetic field power spectrum measurements. Top left: Comparison between the observed(blue points) and simulated RM structure functions. Top right, bottom left, and bottom right: Posterior distributions of normalisation vs slope, maximum vs minimum scales, and maximum scale vs slope, respectively. The last three panels show histograms of each parameter. The contours show the 1, 2, and 3σ levels associated with the distributions. |
| In the text | |
|
Fig. 2. Magnetic field profile measurements. Left: Comparison between the observed RM standard deviation profile (blue points) and the distribution of simulated profiles. Right: Posterior distribution of the central strength and slope of the magnetic field profile. |
| In the text | |
|
Fig. 3. Normalized magnetic field power spectra. Blue, red, and orange lines correspond to merging galaxy clusters, relaxed galaxy clusters, and galaxy groups, respectively; solid and dotted lines are used for systems with or without central extended radio galaxies. The Fornax cluster is represented by a solid black line. |
| In the text | |
|
Fig. 4. Magnetic field autocorrelation length as a function of M500, colour-coded as in Fig. 3. Diamonds, circles, and squares show merging clusters, relaxed clusters, and galaxy groups, respectively. The Fornax cluster measurement is shown as a black triangle. Filled symbols indicate which systems host an extended radio galaxy at the centre. |
| In the text | |
|
Fig. 5. Magnetic field central strength as a function of central thermal density, using the same colour and symbol code described in Fig. 4. The dashed line represents the best-fit model (parameters shown in the bottom-right corner), with uncertainties indicated by the shaded grey area. |
| In the text | |
|
Fig. 6. Normalized magnetic-field strength profiles as a function of the ratio between the distance from the cluster centre and R500. The line styles are consistent with those in Fig. 3. The shaded grey areas indicate the location of the cold front detected by Su et al. (2017), while the vertical black line shows the extension of the radio lobes associated with NGC 1399. |
| In the text | |
Current usage metrics show cumulative count of Article Views (full-text article views including HTML views, PDF and ePub downloads, according to the available data) and Abstracts Views on Vision4Press platform.
Data correspond to usage on the plateform after 2015. The current usage metrics is available 48-96 hours after online publication and is updated daily on week days.
Initial download of the metrics may take a while.