Open Access
Fig. 2.
Download original image
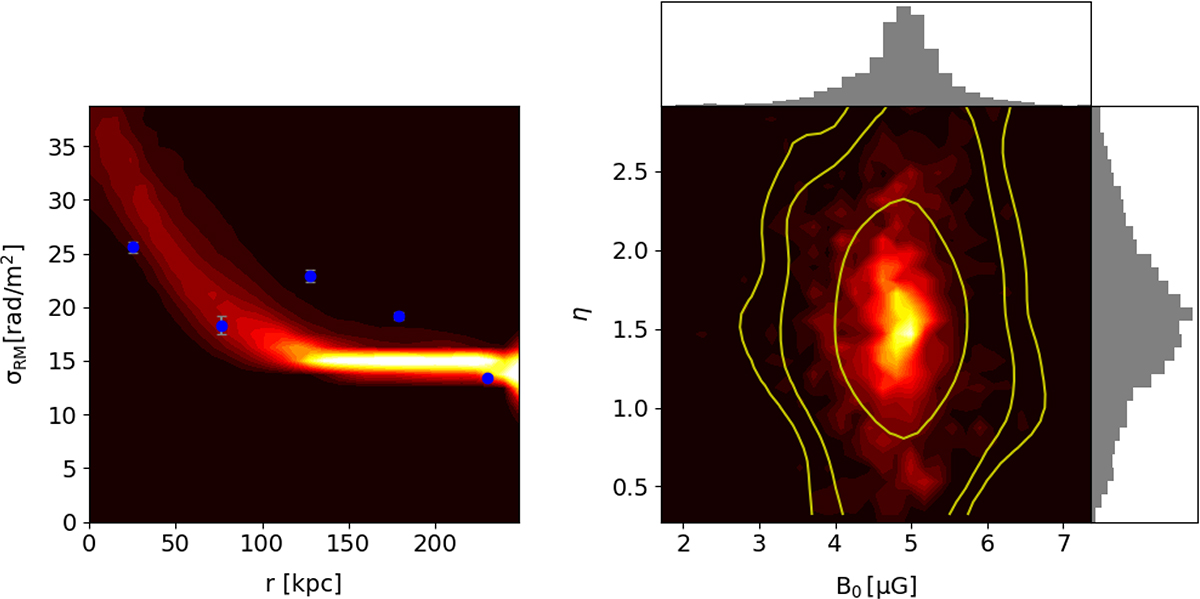
Magnetic field profile measurements. Left: Comparison between the observed RM standard deviation profile (blue points) and the distribution of simulated profiles. Right: Posterior distribution of the central strength and slope of the magnetic field profile.
Current usage metrics show cumulative count of Article Views (full-text article views including HTML views, PDF and ePub downloads, according to the available data) and Abstracts Views on Vision4Press platform.
Data correspond to usage on the plateform after 2015. The current usage metrics is available 48-96 hours after online publication and is updated daily on week days.
Initial download of the metrics may take a while.