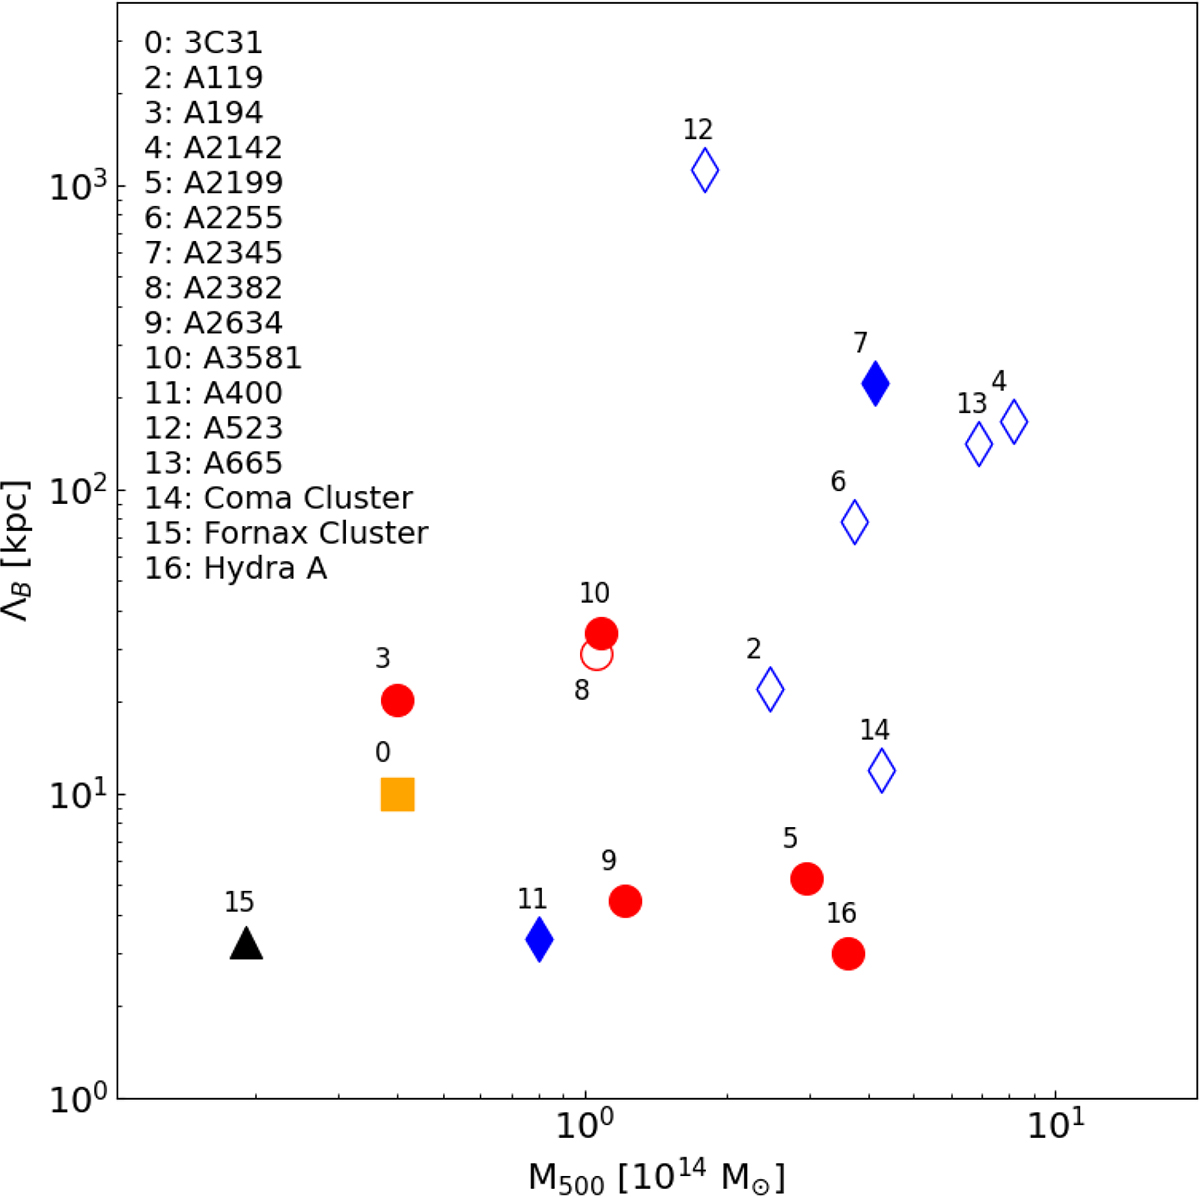
Fig. 4.
Download original image
Magnetic field autocorrelation length as a function of M500, colour-coded as in Fig. 3. Diamonds, circles, and squares show merging clusters, relaxed clusters, and galaxy groups, respectively. The Fornax cluster measurement is shown as a black triangle. Filled symbols indicate which systems host an extended radio galaxy at the centre.
Current usage metrics show cumulative count of Article Views (full-text article views including HTML views, PDF and ePub downloads, according to the available data) and Abstracts Views on Vision4Press platform.
Data correspond to usage on the plateform after 2015. The current usage metrics is available 48-96 hours after online publication and is updated daily on week days.
Initial download of the metrics may take a while.