Open Access
Fig. D.1.
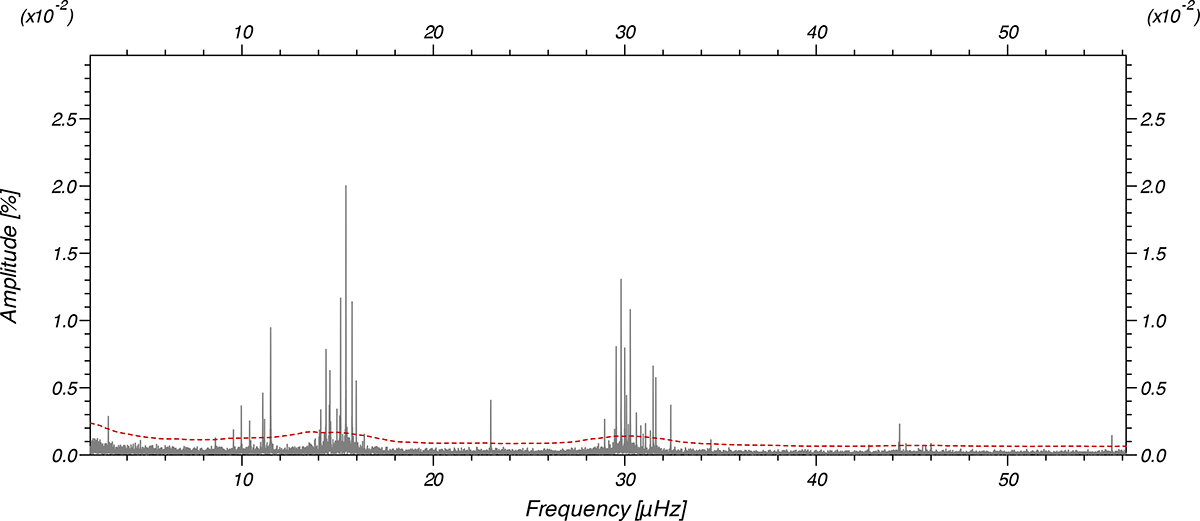
Download original image
Oscillation spectrum of KIC 2309579. The frequency axis is represented in μHz, and the amplitude axis is represented in %. The dashed red curve represents the 4σ noise threshold before prewhitening.
Current usage metrics show cumulative count of Article Views (full-text article views including HTML views, PDF and ePub downloads, according to the available data) and Abstracts Views on Vision4Press platform.
Data correspond to usage on the plateform after 2015. The current usage metrics is available 48-96 hours after online publication and is updated daily on week days.
Initial download of the metrics may take a while.