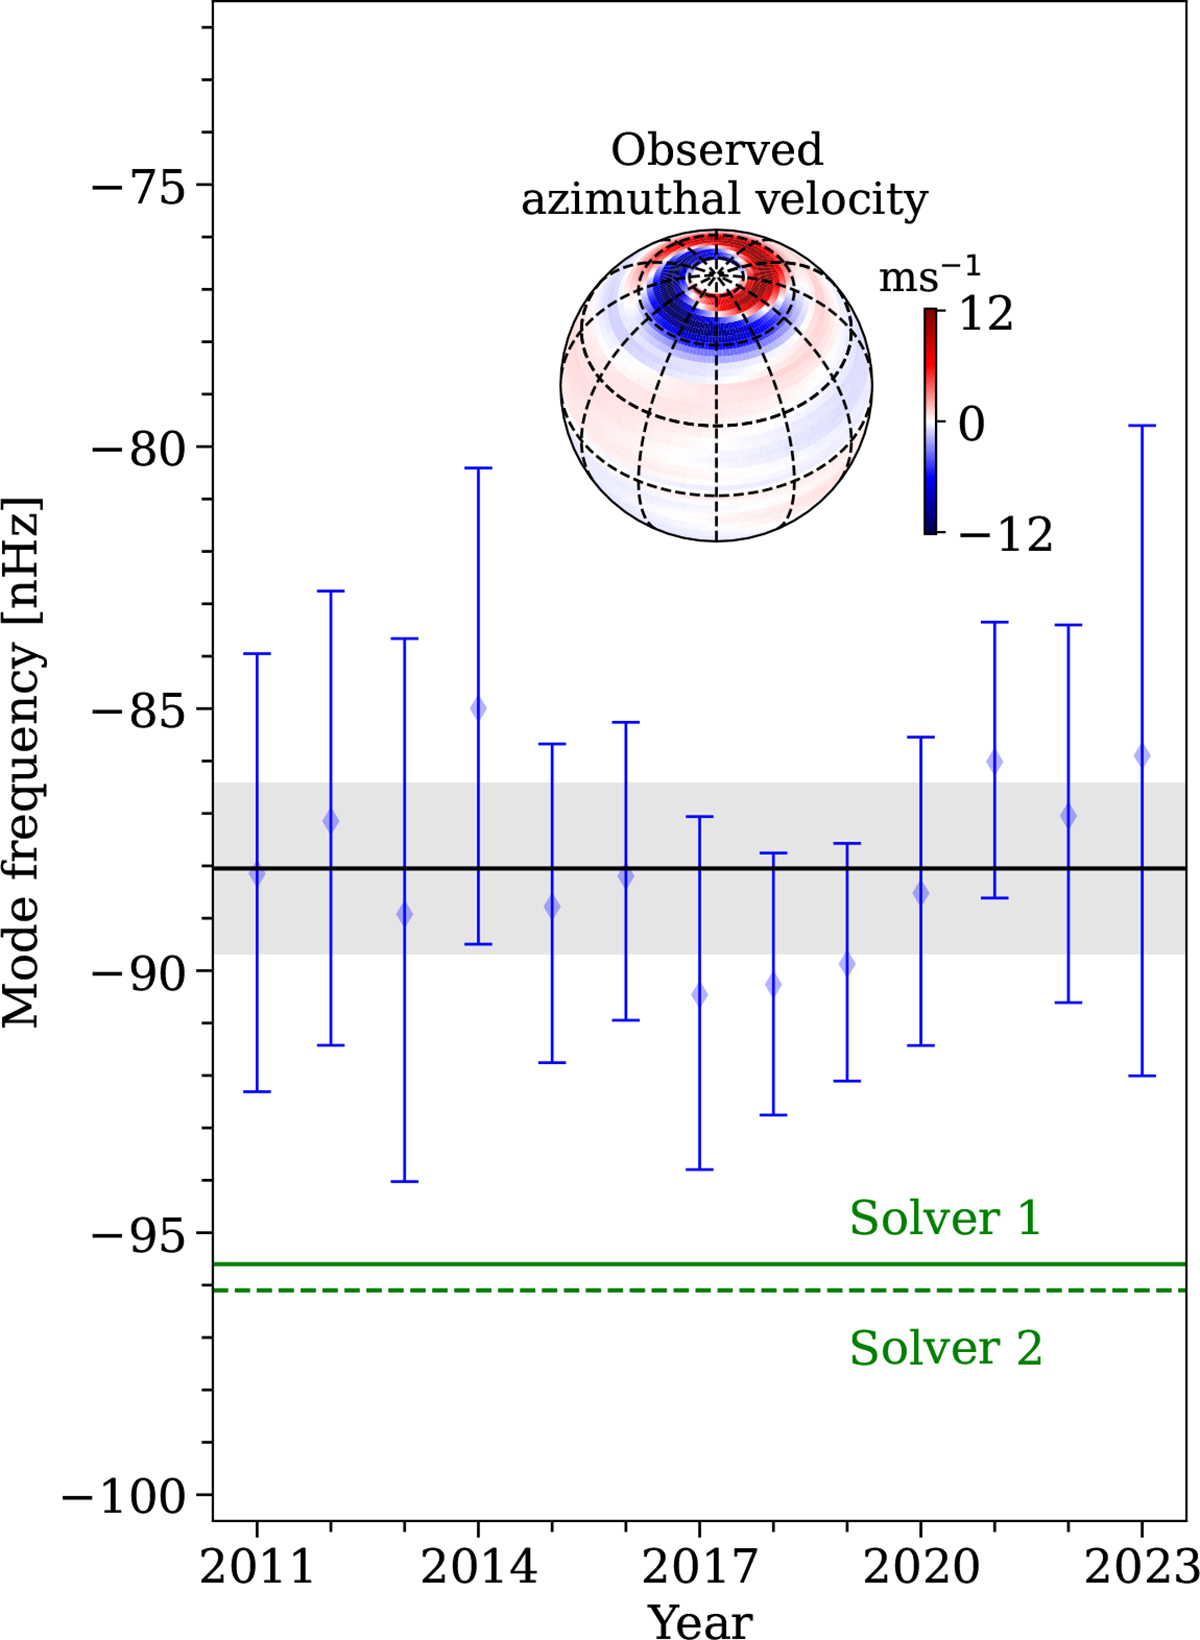
Fig. 1.
Download original image
Observed HL1 frequencies in the Carrington reference frame extracted from HMI Dopplergrams at a cadence of one year with a three-year sliding window (blue points with error bars, Liang & Gizon 2025). The mean frequency ωobs/2π = −87.9 nHz is indicated by the black horizontal line, and the gray shaded region shows the ±1σ range (±1.9 nHz). The frequency uncertainty was estimated from measurements over independent time intervals centered on 2012, 2015, 2018, and 2021, thereby accounting for correlations introduced by the sliding window. The solid green line marks the real part of the eigenfrequency computed using eigenvalue Solver 1 (−95.6 nHz), and the dashed green line marks the same for Solver 2 (−96.1 nHz). The azimuthal velocity of the observed mode at the surface is shown as an inset (adapted from Gizon et al. 2021).
Current usage metrics show cumulative count of Article Views (full-text article views including HTML views, PDF and ePub downloads, according to the available data) and Abstracts Views on Vision4Press platform.
Data correspond to usage on the plateform after 2015. The current usage metrics is available 48-96 hours after online publication and is updated daily on week days.
Initial download of the metrics may take a while.