Fig. 4.
Download original image
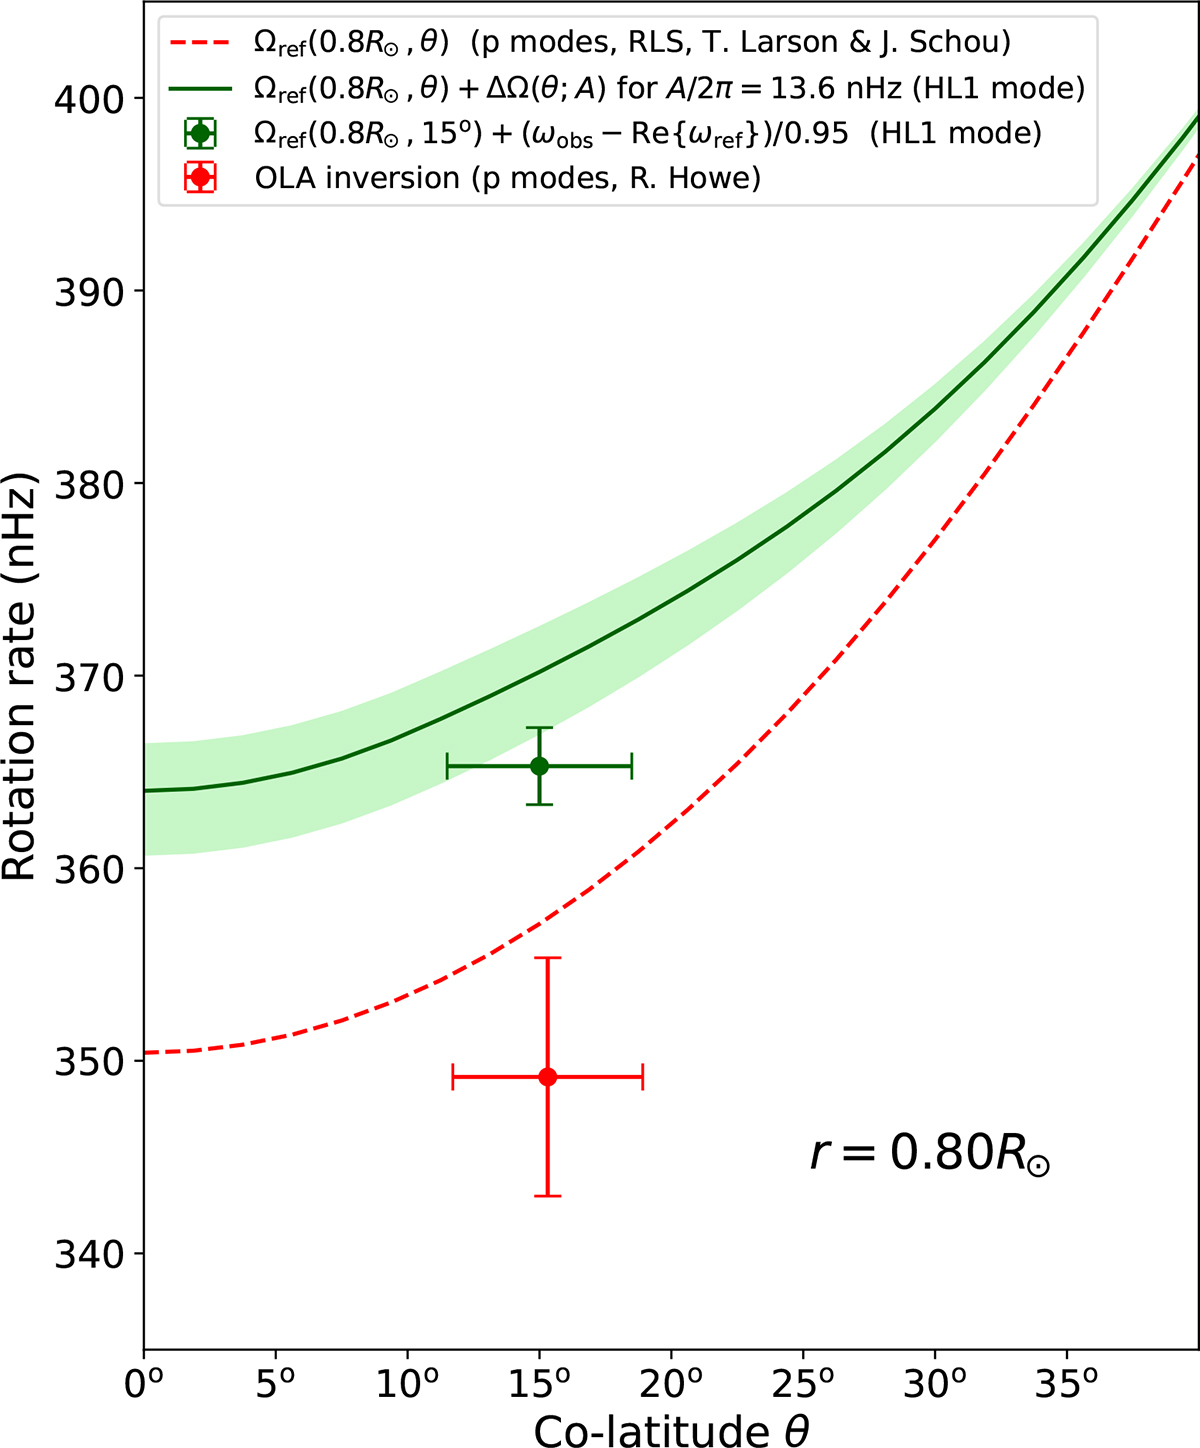
Constraints on high-latitude solar rotation rate at r = 0.8 R⊙. The green cross shows the constraint from the HL1 mode frequency (2010–2024), according to Eq. (5), with the horizontal bar indicating the width of the kernel. The green curve shows the rotation rate Ωref(r, θ)+ΔΩ(θ; A) for A/2π = 13.6 nHz, and the green shaded region indicates the associated uncertainty (see Fig. 3). The p-mode reference rotation rate Ωref(0.8 R⊙, θ) is given by the red dashed curve. The red cross shows a p-mode OLA estimate at the target location (0.8 R⊙, θ = 15° ) obtained from yearly HMI inversions (Howe 2009) averaged over 2010–2023. The horizontal bar represents the width of the averaging kernel, while the vertical bar represents the random error.
Current usage metrics show cumulative count of Article Views (full-text article views including HTML views, PDF and ePub downloads, according to the available data) and Abstracts Views on Vision4Press platform.
Data correspond to usage on the plateform after 2015. The current usage metrics is available 48-96 hours after online publication and is updated daily on week days.
Initial download of the metrics may take a while.