Online Material
Appendix A: Properties of individual galaxies
In this appendix, we present the morphological, kinematical and dynamical properties for each galaxy derived from
I-band images, H![]() flux maps, radial velocity maps, velocity dispersion maps and their associated error maps (Figs. A.1 to A.9). On each velocity map, the kinematical center used for the kinematical analysis is plotted with a black and white double cross.
The kinematical position angle is also displayed and ends at half light radius r1/2 (Table 5). The flux contours are overplotted on both velocity fields and velocity dispersion maps. In all figures, North is up and East is to the left. The kinematical parameters and the masses are given in Tables 4 and 5.
In error maps, pixels with values out of the scale range are displayed in white.
flux maps, radial velocity maps, velocity dispersion maps and their associated error maps (Figs. A.1 to A.9). On each velocity map, the kinematical center used for the kinematical analysis is plotted with a black and white double cross.
The kinematical position angle is also displayed and ends at half light radius r1/2 (Table 5). The flux contours are overplotted on both velocity fields and velocity dispersion maps. In all figures, North is up and East is to the left. The kinematical parameters and the masses are given in Tables 4 and 5.
In error maps, pixels with values out of the scale range are displayed in white.
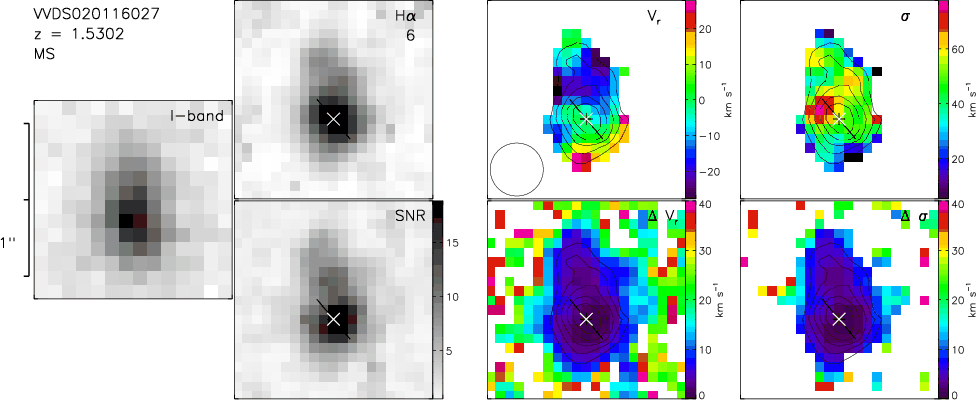 |
Figure A.1:
VVDS020116027 maps. From left to right: I-band CFHT legacy survey best seeing image, H |
| Open with DEXTER | |
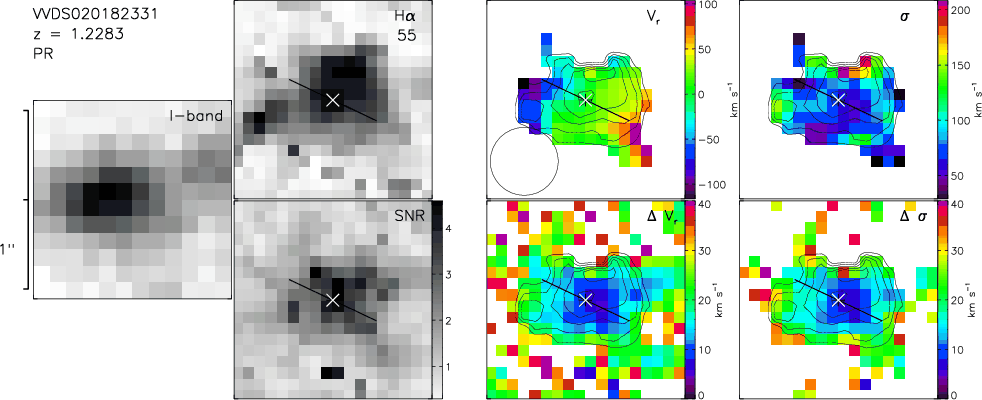 |
Figure A.2: Same as Fig. A.1 for VVDS020182331. The signal to noise ratio threshold for this galaxy has been set to 1.5. |
| Open with DEXTER | |
VVDS020116027.
This galaxy shows a faint and irregular velocity gradient. The H![]() flux map, the velocity field and the velocity dispersion map suggest
two components separated by about 6 kpc (0.75
flux map, the velocity field and the velocity dispersion map suggest
two components separated by about 6 kpc (0.75
![]() ). Indeed, the velocities decrease from South to North accross the main component but decrease by around 15
). Indeed, the velocities decrease from South to North accross the main component but decrease by around 15
![]() when reaching the faint component. The separation between the two components is characterized by a higher velocity dispersion that could indicate a merging event (Amram et al. 2007) or an unresolved gap in velocity between the two components.
The velocity separation of the centers of these two components is close to 0
when reaching the faint component. The separation between the two components is characterized by a higher velocity dispersion that could indicate a merging event (Amram et al. 2007) or an unresolved gap in velocity between the two components.
The velocity separation of the centers of these two components is close to 0
![]() .
The merging timescale would be around 0.4 Gyr (from Kitzbichler & White 2008). The faint component is not seen in the I-band CFHTLS image, but the system appears as distorted and elongated, leading to an inclination of the whole system of 50
.
The merging timescale would be around 0.4 Gyr (from Kitzbichler & White 2008). The faint component is not seen in the I-band CFHTLS image, but the system appears as distorted and elongated, leading to an inclination of the whole system of 50![]() .
The very low maximum rotation velocity (50
.
The very low maximum rotation velocity (50
![]() )
may indicate that the object is almost not rotating (
)
may indicate that the object is almost not rotating (
![]() )
or that the main component is seen nearly face-on.
)
or that the main component is seen nearly face-on.
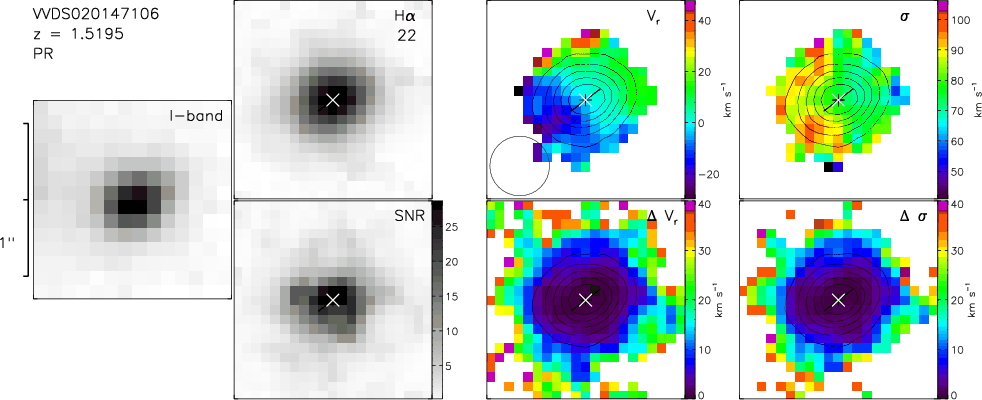 |
Figure A.3: Same as Fig. A.1 for VVDS020147106. |
| Open with DEXTER | |
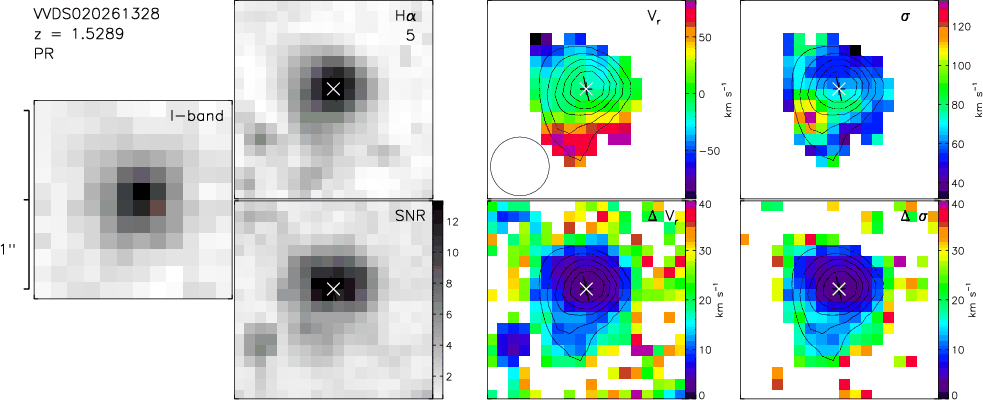 |
Figure A.4: Same as Fig. A.1 for VVDS020261328. The East feature in the signal to noise ratio map corresponds to a badly subtracted cosmic ray. |
| Open with DEXTER | |
VVDS020182331.
The flux of this galaxy is mostly concentrated in the central parts. This galaxy shows a perturbed velocity field. A strong sky line residual (14605 Å) perturbs the line measurements and is responsible for both northern velocity dispersion and line flux peaks observed towards the North.
The uncertainty on the velocity measurements is lower than 20
![]() for the central arcsecond only (in diameter). In this central part, a rotating disk model is acceptable. The corrected velocity dispersion of this object is high (71
for the central arcsecond only (in diameter). In this central part, a rotating disk model is acceptable. The corrected velocity dispersion of this object is high (71
![]() ). We do not detect in H
). We do not detect in H![]() the close-by object revealed in CFHTLS best seeing images, indicating that this object is a foreground or background galaxy or that it is a companion with no star formation with which VVDS020182331 may interact. The latter explanation could explain the perturbed rotation observed in VVDS020182331. This object is slightly more rotation supported than dispersion supported (
the close-by object revealed in CFHTLS best seeing images, indicating that this object is a foreground or background galaxy or that it is a companion with no star formation with which VVDS020182331 may interact. The latter explanation could explain the perturbed rotation observed in VVDS020182331. This object is slightly more rotation supported than dispersion supported (
![]() )
and has a dynamical mass of
)
and has a dynamical mass of
![]() .
It is classified as a perturbed rotator.
.
It is classified as a perturbed rotator.
VVDS020147106.
The H![]() flux is concentrated in the center. The size of the galaxy is twice the seeing (see Table 1). This galaxy shows a faint velocity shear compatible with a face-on rotating disk. The velocity dispersion map does not show any peak but is higher on the eastern side (by about 20
flux is concentrated in the center. The size of the galaxy is twice the seeing (see Table 1). This galaxy shows a faint velocity shear compatible with a face-on rotating disk. The velocity dispersion map does not show any peak but is higher on the eastern side (by about 20
![]() ). The northern edge shows higher velocities of about 30
). The northern edge shows higher velocities of about 30
![]() .
However, the one pixel crown of the edges has higher uncertainties due to a low signal to noise ratio (lower than 4) and was masked to fit a rotating disk model. The fit indicates that a low velocity plateau (30
.
However, the one pixel crown of the edges has higher uncertainties due to a low signal to noise ratio (lower than 4) and was masked to fit a rotating disk model. The fit indicates that a low velocity plateau (30
![]() )
is reached close to the center. This low maximum rotation velocity suggests that the inclination of this system is even lower than suggested from the I-band image or that this object is strongly dispersion dominated (
)
is reached close to the center. This low maximum rotation velocity suggests that the inclination of this system is even lower than suggested from the I-band image or that this object is strongly dispersion dominated (
![]() ). Due to the compactness of this object (
r1/2=1.2 kpc) and compared to the total extent of H
). Due to the compactness of this object (
r1/2=1.2 kpc) and compared to the total extent of H![]() emission (
emission (
![]() kpc), the dispersion mass is estimated to be
kpc), the dispersion mass is estimated to be
![]() ,
which is 15 times larger than the stellar mass (
,
which is 15 times larger than the stellar mass (
![]() ). This suggests that this star-forming galaxy is embedded in a large dark matter halo or that it contains a large amount of gas. Even if it cannot be excluded that this galaxy is a dispersion dominated spheroid
, this galaxy is classified as a perturbed rotating disk since it has a high velocity dispersion (80
). This suggests that this star-forming galaxy is embedded in a large dark matter halo or that it contains a large amount of gas. Even if it cannot be excluded that this galaxy is a dispersion dominated spheroid
, this galaxy is classified as a perturbed rotating disk since it has a high velocity dispersion (80
![]() )
and shows rotation in its perturbed velocity field. The asymmetries observed in the velocity maps could be accounted for by a minor merging event.
)
and shows rotation in its perturbed velocity field. The asymmetries observed in the velocity maps could be accounted for by a minor merging event.
VVDS020261328.
The H![]() flux map is peaked and faintly extends toward the South. The velocity dispersion map has a peak around 120
flux map is peaked and faintly extends toward the South. The velocity dispersion map has a peak around 120
![]() to the South-East. The velocity field shows a clear but irregular velocity shear of about 100
to the South-East. The velocity field shows a clear but irregular velocity shear of about 100
![]() that extends over 0.8
that extends over 0.8
![]() in radius. Fitting a rotating disk model suggests that only the central part of the galaxy is detected since the plateau is not reached. It also shows that the velocity dispersion peak cannot be explained by beam smearing effects. For the same reasons as VVDS020147106, VVDS020261328 has a dynamical mass (
in radius. Fitting a rotating disk model suggests that only the central part of the galaxy is detected since the plateau is not reached. It also shows that the velocity dispersion peak cannot be explained by beam smearing effects. For the same reasons as VVDS020147106, VVDS020261328 has a dynamical mass (
![]() )
30 times higher than the stellar mass (
)
30 times higher than the stellar mass (
![]() ), suggesting
that dark matter and cool gas dominate the gravitational potential of this galaxy. The SFR is the lowest of our sample (see Table 3).
This galaxy is classified as a pertubed rotator that is mainly rotation supported (
), suggesting
that dark matter and cool gas dominate the gravitational potential of this galaxy. The SFR is the lowest of our sample (see Table 3).
This galaxy is classified as a pertubed rotator that is mainly rotation supported (
![]() ).
).
VVDS220596913.
The H![]() flux map shows two main components separated by 12.5 kpc (1.5
flux map shows two main components separated by 12.5 kpc (1.5
![]() )
that are not clearly distinguished in the I-band image. The brigthest component is located on the western side and is composed of two peaks of equal intensity. The eastern component is much fainter. It has a smooth velocity gradient and two peaks in the velocity dispersion map (around 100
)
that are not clearly distinguished in the I-band image. The brigthest component is located on the western side and is composed of two peaks of equal intensity. The eastern component is much fainter. It has a smooth velocity gradient and two peaks in the velocity dispersion map (around 100
![]() ). One corresponds to the brightest H
). One corresponds to the brightest H![]() knot, and the other is more diffuse and corresponds to the transition region between the two components where the H
knot, and the other is more diffuse and corresponds to the transition region between the two components where the H![]() emission is the faintest (signal to noise ratio around 4). The high velocity dispersion between the two components can be a signature of merging as for the Hickson compact group H31 (Amram et al. 2007). The velocity shear of the faint component is misaligned by around 20
emission is the faintest (signal to noise ratio around 4). The high velocity dispersion between the two components can be a signature of merging as for the Hickson compact group H31 (Amram et al. 2007). The velocity shear of the faint component is misaligned by around 20![]() with respect to the one of the bright component suggesting, as does the flux distribution, that this system is composed of two galaxies in the process of merging. The velocity separation of the two components is estimated to be
with respect to the one of the bright component suggesting, as does the flux distribution, that this system is composed of two galaxies in the process of merging. The velocity separation of the two components is estimated to be ![]() 150
150
![]() .
The merging timescale would be around 1.2 Gyr.
Although a large and unique rotating disk consituted by large clumps as seen in Bournaud et al. (2008) cannot be excluded (leading to
.
The merging timescale would be around 1.2 Gyr.
Although a large and unique rotating disk consituted by large clumps as seen in Bournaud et al. (2008) cannot be excluded (leading to
![]() ), fitting the brightest component alone gives better results in terms of
), fitting the brightest component alone gives better results in terms of ![]() ,
suggesting that the main component is rotating with a maximum velocity of around 200
,
suggesting that the main component is rotating with a maximum velocity of around 200
![]() .
We fixed the center between the two flux peaks of the main component, and used an inclination of 55
.
We fixed the center between the two flux peaks of the main component, and used an inclination of 55![]() .
Assuming that both components have the same dimensions (half the whole system dimensions), we obtained a dynamical mass of around
.
Assuming that both components have the same dimensions (half the whole system dimensions), we obtained a dynamical mass of around
![]() (dominated by rotation) for the bright component and
(dominated by rotation) for the bright component and
![]() (dominated by dispersion) for the faint one. This implies a total dynamical mass of
(dominated by dispersion) for the faint one. This implies a total dynamical mass of ![]()
![]() ,
of the same order as the one computed considering a unique object (
,
of the same order as the one computed considering a unique object (![]()
![]() ).
This object is classified as a major merger system.
).
This object is classified as a major merger system.
VVDS220584167.
VVDS220584167 is the object that presents the most extended H![]() map of the sample. It has an elongated peak in the velocity dispersion map close to the center. The observation is affected by a strong sky line residual (16195 Å, see Fig. 8) that induces large uncertainties on line measurements, mainly on the southern side.
The velocity field shows asymmetry and the galaxy presents a distorted morphology in the I-band image which makes possible the existence of a strong bar (see for comparison UGC 08937 in Epinat et al. 2009). Moreover, the observed displacement between I-band and H
map of the sample. It has an elongated peak in the velocity dispersion map close to the center. The observation is affected by a strong sky line residual (16195 Å, see Fig. 8) that induces large uncertainties on line measurements, mainly on the southern side.
The velocity field shows asymmetry and the galaxy presents a distorted morphology in the I-band image which makes possible the existence of a strong bar (see for comparison UGC 08937 in Epinat et al. 2009). Moreover, the observed displacement between I-band and H![]() morphologies suggests a violent star formation event compatible with the high SFR of this galaxy.
The velocity field is reasonably fit by a simple rotational disk model, and the central velocity dispersion peak is not accounted for by the model since it does not simulate the effect of a bar. VVDS220584167 is the most massive disk of the sample, with a dynamical mass of
morphologies suggests a violent star formation event compatible with the high SFR of this galaxy.
The velocity field is reasonably fit by a simple rotational disk model, and the central velocity dispersion peak is not accounted for by the model since it does not simulate the effect of a bar. VVDS220584167 is the most massive disk of the sample, with a dynamical mass of
![]() .
It is also the most rotation-dominated object (
.
It is also the most rotation-dominated object (
![]() and
and
![]() ).
Thus this galaxy is classified as a rotating disk with a bar.
).
Thus this galaxy is classified as a rotating disk with a bar.
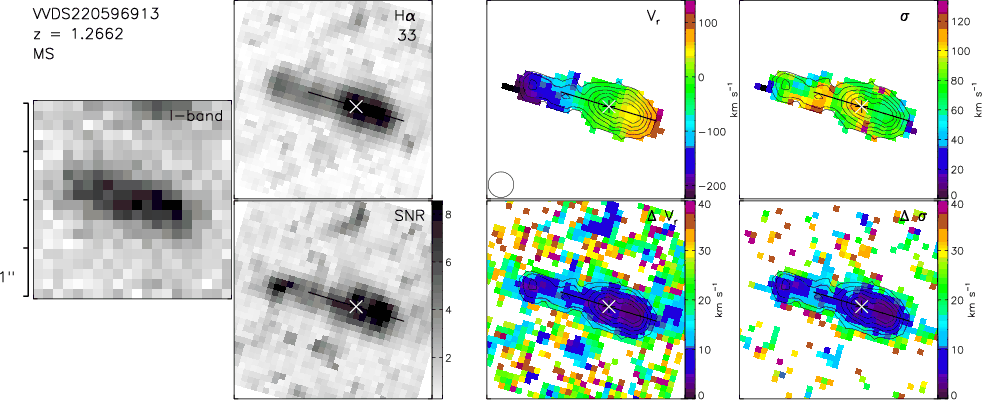 |
Figure A.5: Same as Fig. A.1 for VVDS220596913. The North feature is compatible with sky line residuals. The I-band map is a CFH12K/CFHT image. |
| Open with DEXTER | |
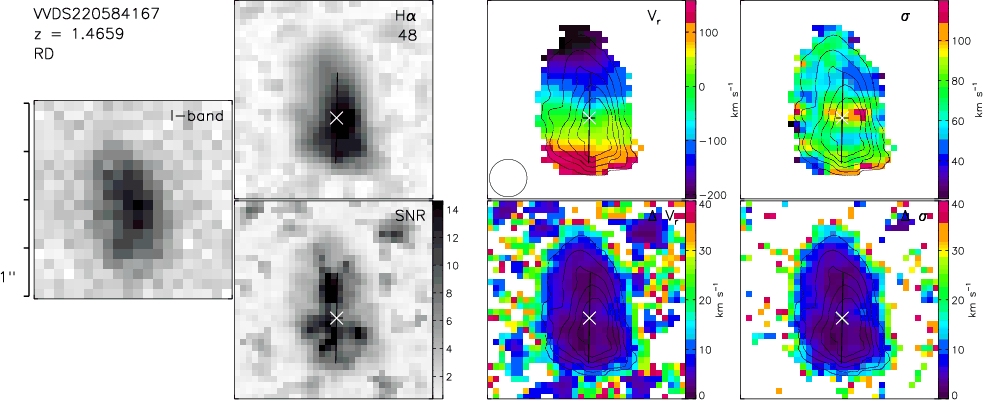 |
Figure A.6: Same as Fig. A.5 for VVDS220584167. The North-West feature is compatible with sky line residuals. |
| Open with DEXTER | |
VVDS220544103.
The H![]() flux map of VVDS220544103 shows two peaks separated by around 6 kpc (0.75
flux map of VVDS220544103 shows two peaks separated by around 6 kpc (0.75
![]() ). It also shows a distorted morphology both in the line flux map and in the I-band image. A faint velocity gradient (
). It also shows a distorted morphology both in the line flux map and in the I-band image. A faint velocity gradient (![]() 30
30
![]() )
is observed toward the main northern peak, whereas a strong velocity gradient (
)
is observed toward the main northern peak, whereas a strong velocity gradient (![]() 120
120
![]() )
is observed to the South of the fainter southern peak. The two gradients are in the same direction and the velocity field is continuous accross the whole object. The isovelocity contours are perpendicular to the distorted and elongated morphology. The strongest peaks in the velocity dispersion are located at the edges where the signal to noise ratio is low. Excluding these peaks, the velocity dispersion map shows an elongated peak close to the faint H
)
is observed to the South of the fainter southern peak. The two gradients are in the same direction and the velocity field is continuous accross the whole object. The isovelocity contours are perpendicular to the distorted and elongated morphology. The strongest peaks in the velocity dispersion are located at the edges where the signal to noise ratio is low. Excluding these peaks, the velocity dispersion map shows an elongated peak close to the faint H![]() flux peak.
Fitting a simple rotating disk model to the whole system leads to a ratio
flux peak.
Fitting a simple rotating disk model to the whole system leads to a ratio
![]() .
However, this object is hard to fit with such a model and the dynamical mass estimates just give an indication of its total mass.
From our data, it is not possible to separate two components and compute mass estimates for both. We estimated the total dynamical mass as
.
However, this object is hard to fit with such a model and the dynamical mass estimates just give an indication of its total mass.
From our data, it is not possible to separate two components and compute mass estimates for both. We estimated the total dynamical mass as
![]() using a unique rotating disk object hypothesis. However, one might guess that at least one component could be seen nearly face-on and thus have a higher maximum velocity and thus a higher total mass.
The velocity separation between the two components is around 40
using a unique rotating disk object hypothesis. However, one might guess that at least one component could be seen nearly face-on and thus have a higher maximum velocity and thus a higher total mass.
The velocity separation between the two components is around 40
![]() .
The merging timescale for this system would be around 0.5 Gyr. This object could be two or more galaxies in a merging process and is classified as a merging system.
.
The merging timescale for this system would be around 0.5 Gyr. This object could be two or more galaxies in a merging process and is classified as a merging system.
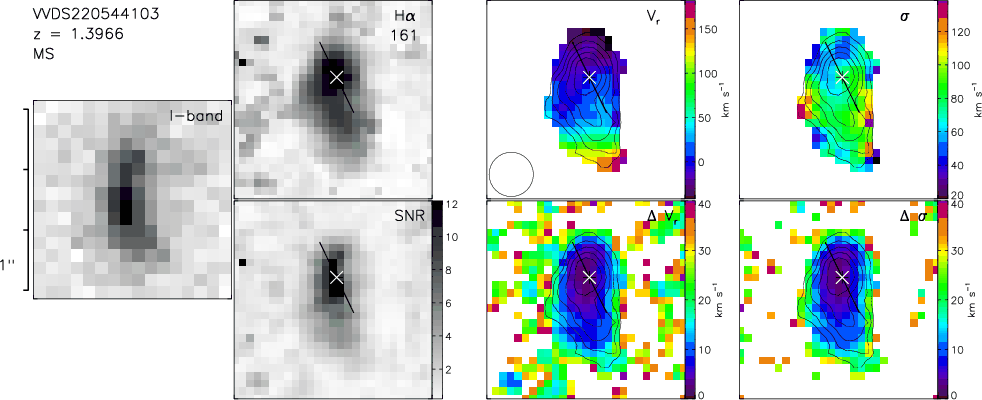 |
Figure A.7: Same as Fig. A.5 for VVDS220544103. |
| Open with DEXTER | |
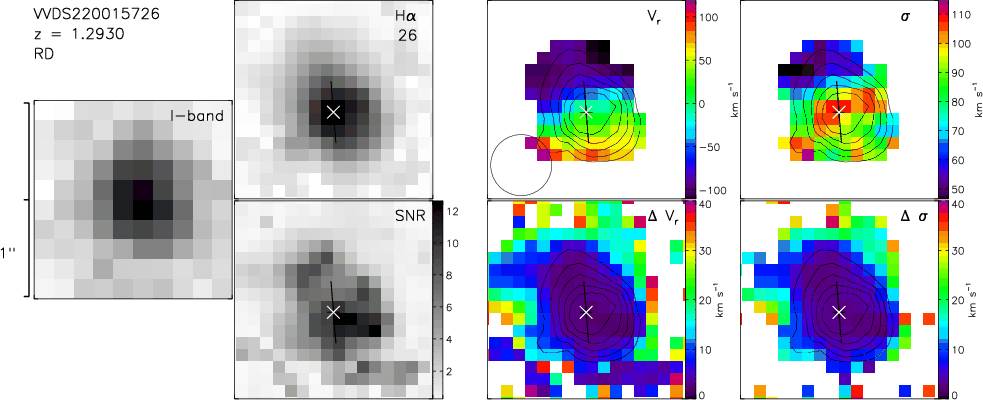 |
Figure A.8: Same as Fig. A.5 for VVDS220015726. |
| Open with DEXTER | |
VVDS220015726.
The central regions give a clean signal, while the low signal regions are affected by sky residuals due to the proximity of two strong sky lines next to H![]() (15053 Å and 15056 Å).
The H
(15053 Å and 15056 Å).
The H![]() map is peaked at the center and it also has a peak at the same location in the velocity dispersion map (
map is peaked at the center and it also has a peak at the same location in the velocity dispersion map (![]() 100
100
![]() ). The kinematical maps of this galaxy are well reproduced by the rotating disk model. In particular, this model shows that the central velocity dispersion is due to beam smearing effects (see Fig. 11). The relatively high
). The kinematical maps of this galaxy are well reproduced by the rotating disk model. In particular, this model shows that the central velocity dispersion is due to beam smearing effects (see Fig. 11). The relatively high ![]() value of the fit is only due to the fact that this object shows the highest velocities. VVDS220015726 is clearly dominated by rotation (
value of the fit is only due to the fact that this object shows the highest velocities. VVDS220015726 is clearly dominated by rotation (
![]() )
since it is the fastest rotator of the sample (
)
since it is the fastest rotator of the sample (
![]()
![]() )
but also the object with the lowest velocity dispersion (
)
but also the object with the lowest velocity dispersion (
![]()
![]() ). Its total dynamical mass (
). Its total dynamical mass (
![]() )
is compatible within the error bars to its stellar mass (
)
is compatible within the error bars to its stellar mass (
![]() ). This indicates that the halo contribution is low in the central parts of this galaxy. This object is classified as a rotating disk.
). This indicates that the halo contribution is low in the central parts of this galaxy. This object is classified as a rotating disk.
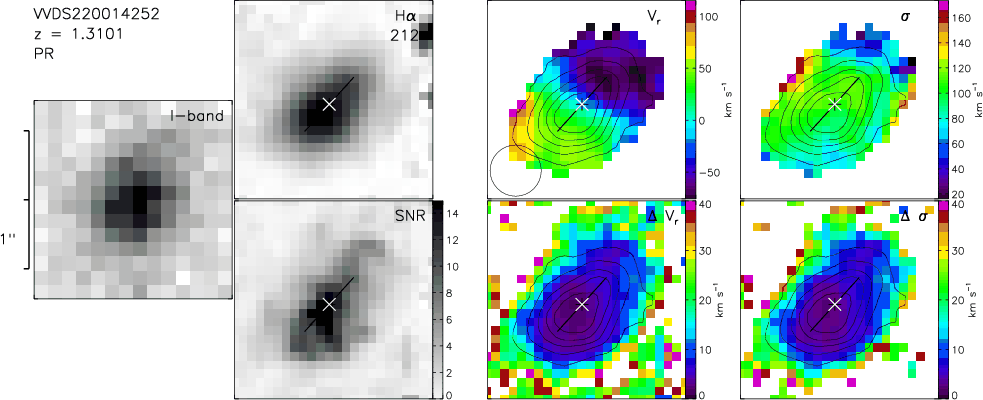 |
Figure A.9: Same as Fig. A.5 for VVDS220014252. |
| Open with DEXTER | |
VVDS220014252.
The H![]() flux map of VVDS220014252 shows an elongated peak and diffuse emission in the outer parts, compatible with the I-band morphology. The peak does not perfectly match the center of external isophotes. The H
flux map of VVDS220014252 shows an elongated peak and diffuse emission in the outer parts, compatible with the I-band morphology. The peak does not perfectly match the center of external isophotes. The H![]() flux map also suggests the presence of an arm on the western side.
The velocity field is the one of a rotating disk except in the eastern side where it shows unexpectedly high velocities.
A rotating disk model correctly fits the velocity field. The fit is better (smaller
flux map also suggests the presence of an arm on the western side.
The velocity field is the one of a rotating disk except in the eastern side where it shows unexpectedly high velocities.
A rotating disk model correctly fits the velocity field. The fit is better (smaller ![]() )
when the center does not match the H
)
when the center does not match the H![]() flux peak, but the center of external isophotes. Adopting an inclination of 56
flux peak, but the center of external isophotes. Adopting an inclination of 56![]() ,
the deprojected maximum rotation velocity is quite low (103
,
the deprojected maximum rotation velocity is quite low (103
![]() ). The model shows that the maximum rotation velocity is reached close to the kinematical center.
The North-West side of the velocity field shows a bump and thus a small decrease.
Around this bump, profiles are broad and asymmetric. Broad profiles (more than 150
). The model shows that the maximum rotation velocity is reached close to the kinematical center.
The North-West side of the velocity field shows a bump and thus a small decrease.
Around this bump, profiles are broad and asymmetric. Broad profiles (more than 150
![]() )
are also observed at the North-East edge, with a rather good signal to noise ratio (larger than 5). The velocity dispersion is not peaked at the center of the galaxy but is high everywhere. Moreover, the mean velocity dispersion of this galaxy is the highest of the whole sample (92
)
are also observed at the North-East edge, with a rather good signal to noise ratio (larger than 5). The velocity dispersion is not peaked at the center of the galaxy but is high everywhere. Moreover, the mean velocity dispersion of this galaxy is the highest of the whole sample (92
![]() ). The model shows that the velocity dispersion is not due to beam smearing effects(see Fig. 11).
The broad and asymmetric profiles suggests the possibility of having intrinsic double profiles that can be signatures of interactions (Amram et al. 2007). Moreover, the kinematics is not dominated by rotation since
). The model shows that the velocity dispersion is not due to beam smearing effects(see Fig. 11).
The broad and asymmetric profiles suggests the possibility of having intrinsic double profiles that can be signatures of interactions (Amram et al. 2007). Moreover, the kinematics is not dominated by rotation since
![]() and the total dynamical mass (
and the total dynamical mass (
![]() )
is dominated by the dispersion mass (
)
is dominated by the dispersion mass (
![]() ).
For these reasons, this galaxy showing the highest SFR of the sample is classified as a perturbed rotator possibly in the process of a minor merging event.
).
For these reasons, this galaxy showing the highest SFR of the sample is classified as a perturbed rotator possibly in the process of a minor merging event.