Fig. 11
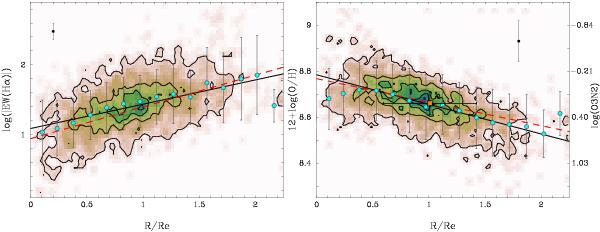
Left panel: radial distribution of the equivalent width of Hα (in logarithm scale of its absolute value), once scaled to the average value at the effective radius for each galaxy. The image and contours show the density distribution of H ii regions in this parameter space. The first contour indicates the mean density, with a regular spacing of four times this value for each consecutive contour. The light-blue solid-circles indicate the mean value (with its corresponding standard deviation represented as error bars), for each consecutive radial bin of ~0.15 Re. The solid line shows the average linear regression found for each individual galaxy, as listed in Table 8. The red dashed line shows the actual regression found for all the H ii regions detected for all the galaxies. The average error of the equivalent width of Hα for the H ii regions represented in this plot is shown by a single error bar located at the top-left side of the panel. Right panel: similar radial distribution for the oxygen abundance derived using the O3N2 indicator, once scaled to the average value at the effective radius for each galaxy, following the same format. The average error of the derived oxygen abundance (without considering systematic errors) is shown by a single error bar located a the top-right side of the panel. The right-side scale shows the corresponding value for the O3N2 indicator. The solid-orange square indicate the average abundance of the solar neighborhood, at the distance of the Sun to the Milky-Way galactic center (in effective radius).
Current usage metrics show cumulative count of Article Views (full-text article views including HTML views, PDF and ePub downloads, according to the available data) and Abstracts Views on Vision4Press platform.
Data correspond to usage on the plateform after 2015. The current usage metrics is available 48-96 hours after online publication and is updated daily on week days.
Initial download of the metrics may take a while.