Fig. 7
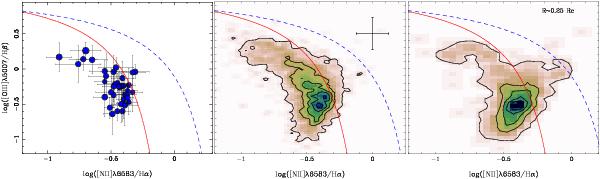
Left panel: [O iii] λ5007/Hβ vs. [N ii] λ6583/Hα diagnostic diagram for the average properties of the H ii regions galaxy by galaxy listed in Table 7. The error bars indicate the standard deviation from the mean value. Middle panel: similar diagnostic diagram for all the emission line regions detected by the described analysis with good quality measurements of both parameters (2230 regions). The colour image and contours show the density distribution of these regions. The first contour indicates the mean density, with each consecutive one increasing by four times this mean value. The Kauffmann et al. (2003) (red solid-line) and Kewley et al. (2001) (blue dashed-line) demarcation curves are usually invoked to distinguish between star-forming regions (below the red solid-line), and other source of ionization, like AGN/shocks/post-AGB (above the blue line). Regions between both lines are considered intermediate ones, indicating a mixed origin for the ionization. The error-bars at the top-left indicate the typical (mean) errors for the considered line ratios. Right panel: similar diagram, including only the 124 regions at the core of each galaxy (r < 0.5re, i.e., at ~0.25re in average). The fraction of regions in the intermediate location is clearly higher.
Current usage metrics show cumulative count of Article Views (full-text article views including HTML views, PDF and ePub downloads, according to the available data) and Abstracts Views on Vision4Press platform.
Data correspond to usage on the plateform after 2015. The current usage metrics is available 48-96 hours after online publication and is updated daily on week days.
Initial download of the metrics may take a while.