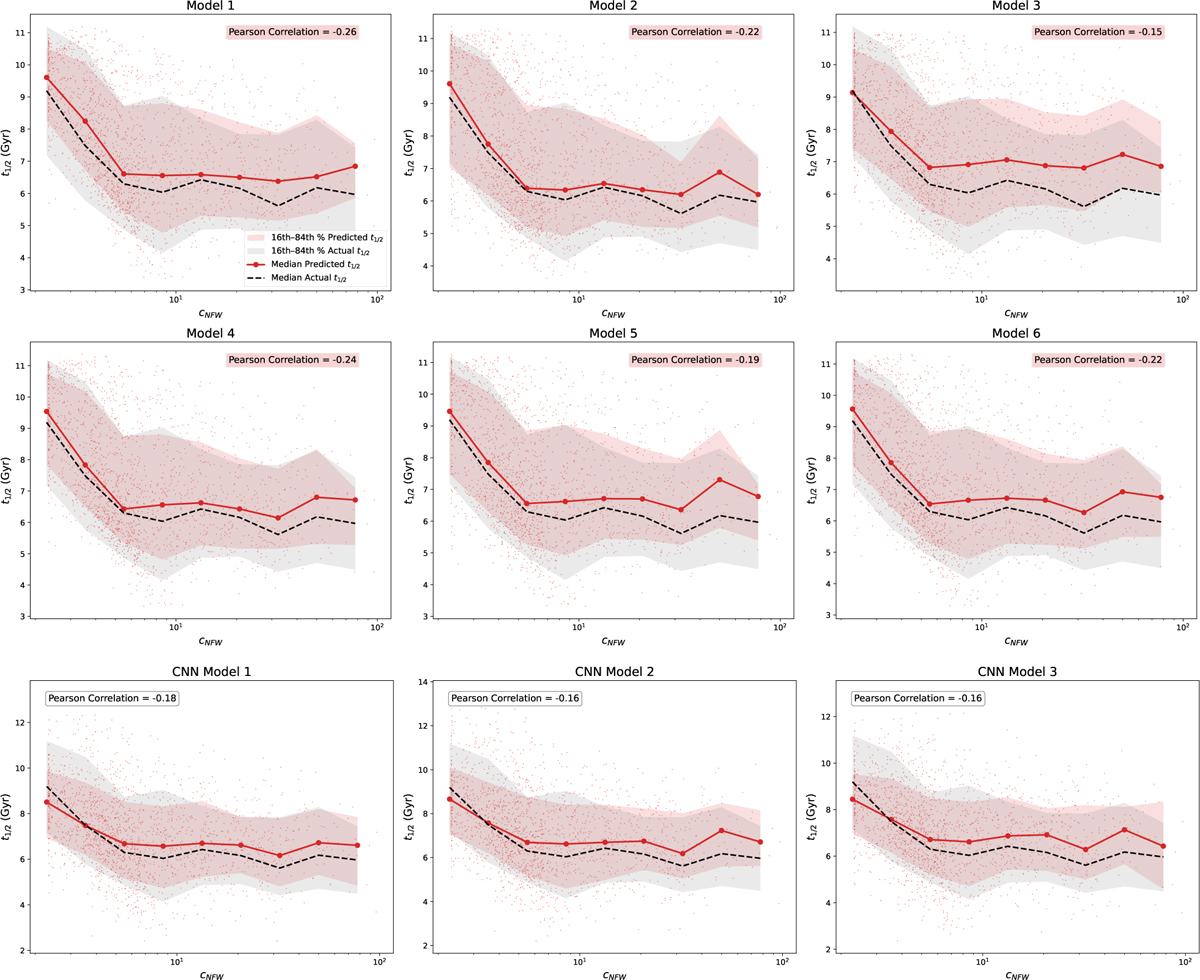
Fig. 11
Download original image
Correlation between the halo concentration parameter cNFW and t1/2 across different RF and CNN models. The first and second rows show the correlation trends for the six RF models discussed in Section 3, while the third row corresponds to the three CNN models described in Section 4. In each panel, the shaded red region represents the 16th-84th percentile range of the ML predictions, and the shaded gray region shows the same range for the actual simulation values. The solid red and dotted black lines indicate the median t1/2 in logarithmic bins for the ML models and the simulation, respectively. Pearson correlation coefficients are annotated to quantify the strength of the relationship between cNFW and the predicted formation times.
Current usage metrics show cumulative count of Article Views (full-text article views including HTML views, PDF and ePub downloads, according to the available data) and Abstracts Views on Vision4Press platform.
Data correspond to usage on the plateform after 2015. The current usage metrics is available 48-96 hours after online publication and is updated daily on week days.
Initial download of the metrics may take a while.