Open Access
Fig. A.1
Download original image
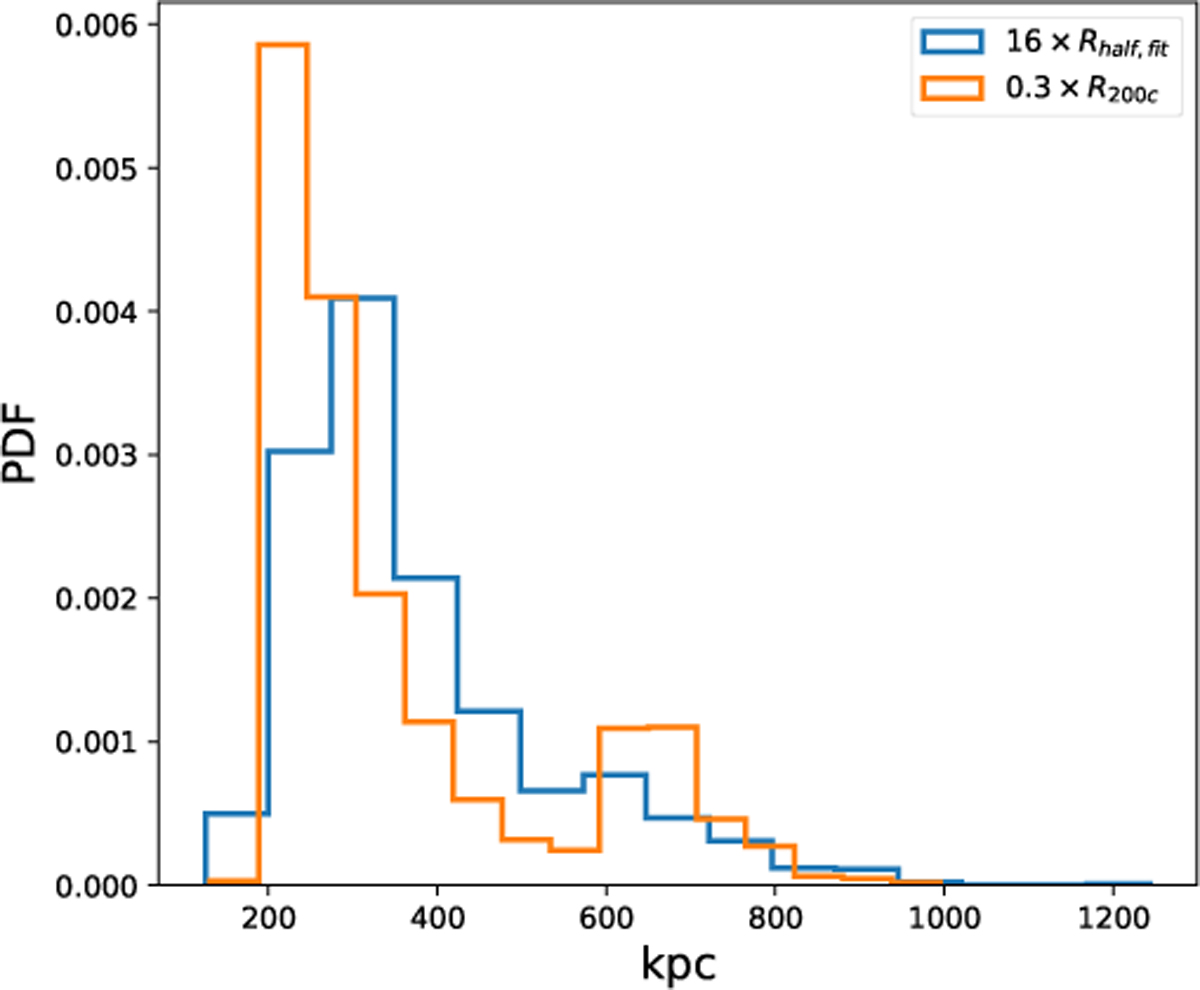
Histograms showing the distribution of 0.3R200c and 16Rhalf,fit for the halos used in this study.
In Figure A.1, we show the distributions of 0.3 × R200c and 16 × Rhalf,fit for the halos, representing the maximum edges of the bins used to construct property maps with Binning Methodology 2 and Binning Methodology 3.
Current usage metrics show cumulative count of Article Views (full-text article views including HTML views, PDF and ePub downloads, according to the available data) and Abstracts Views on Vision4Press platform.
Data correspond to usage on the plateform after 2015. The current usage metrics is available 48-96 hours after online publication and is updated daily on week days.
Initial download of the metrics may take a while.