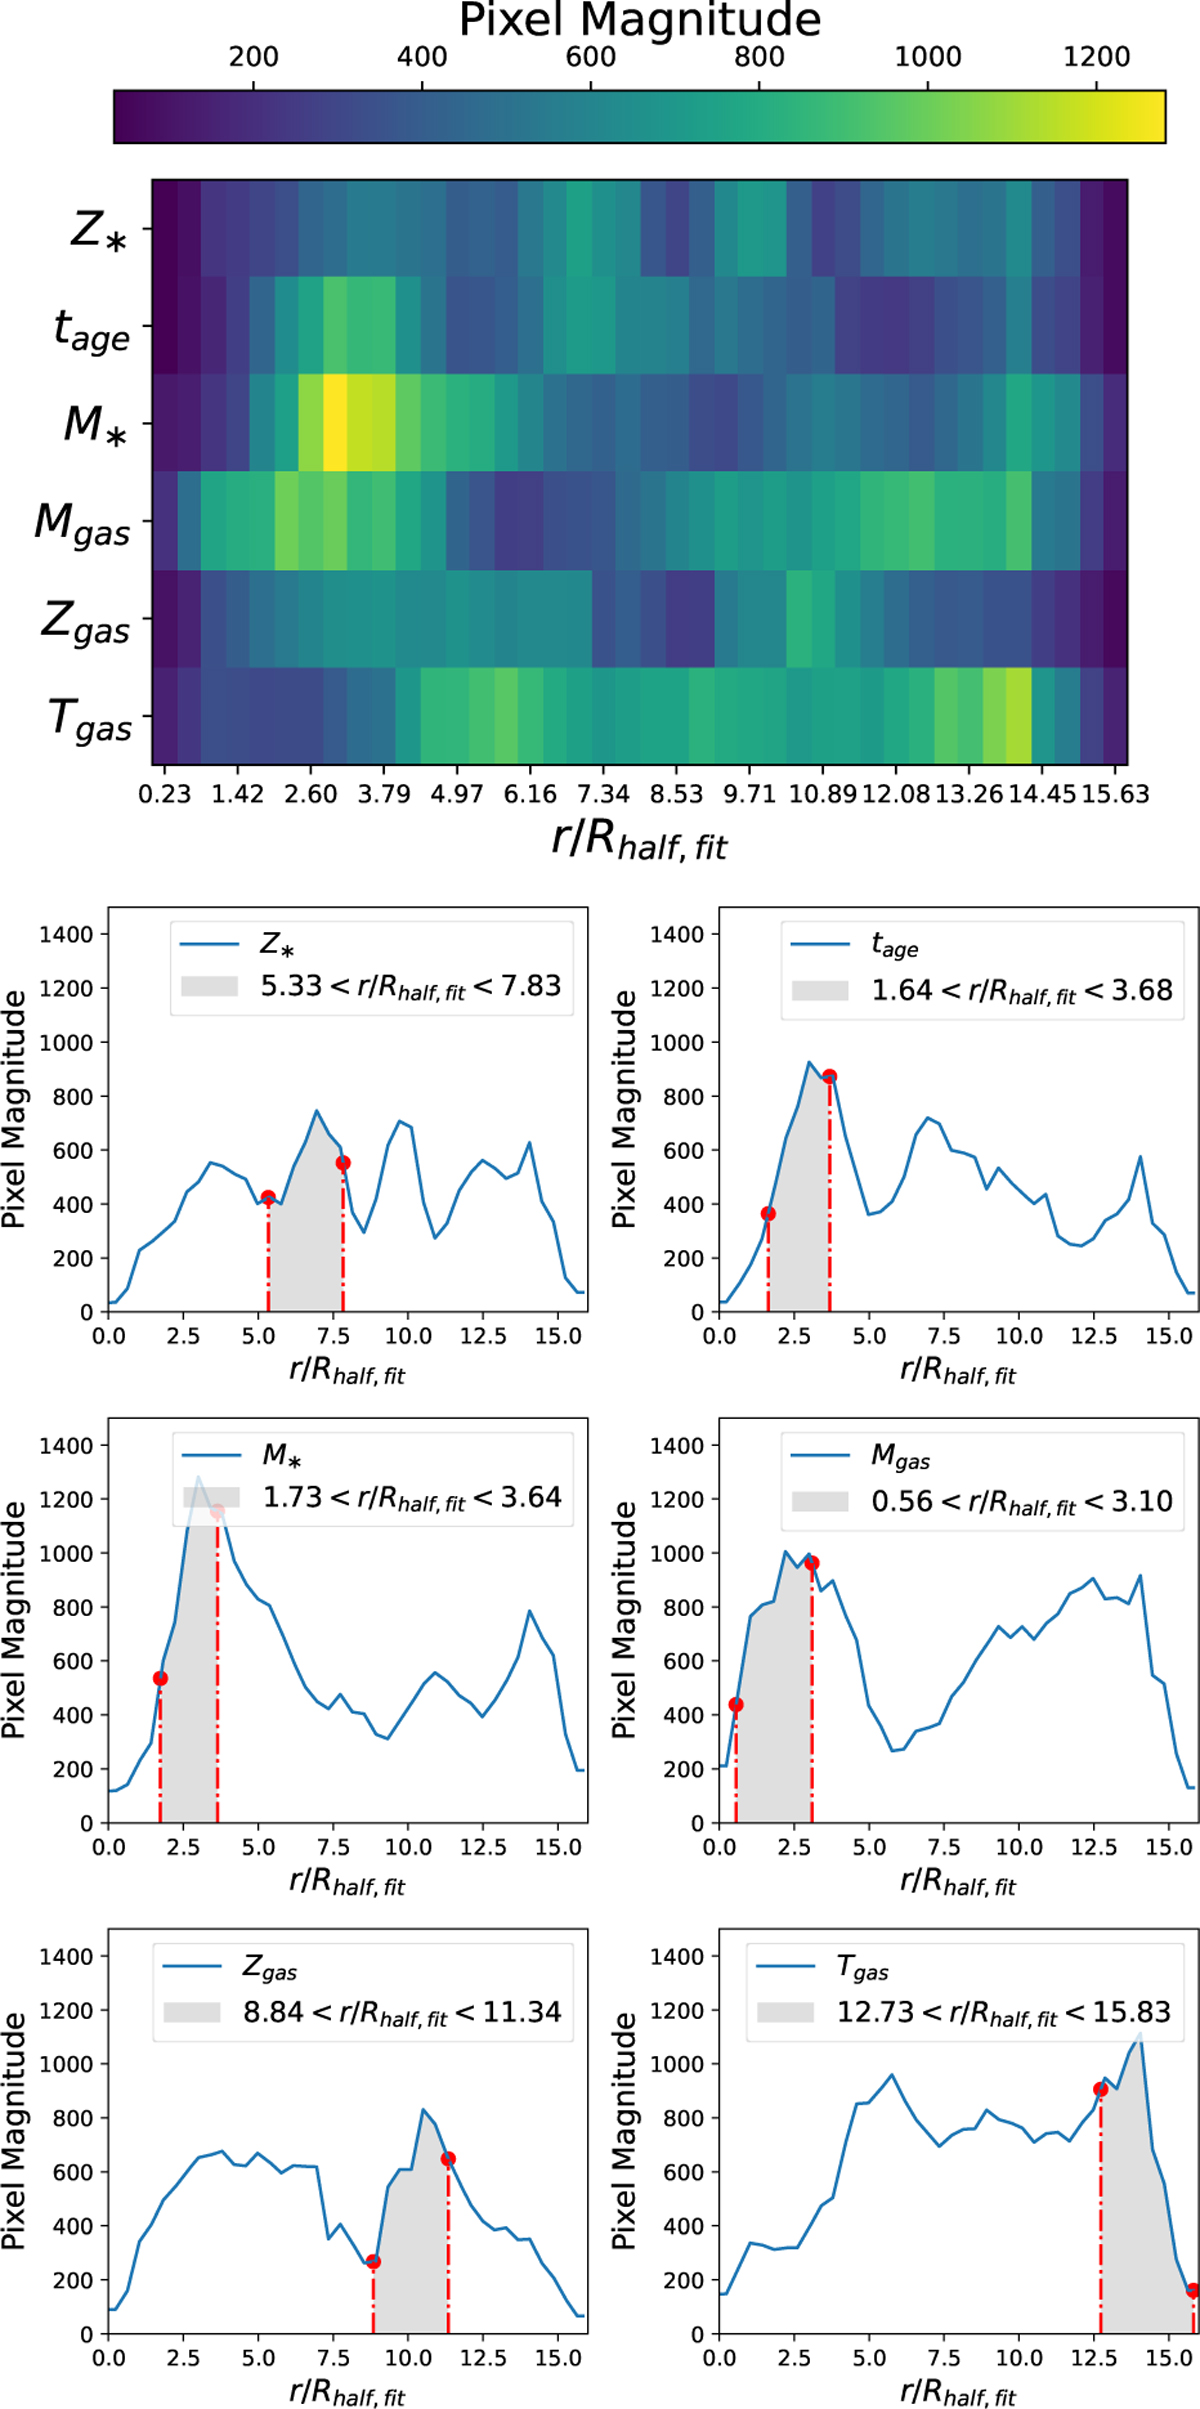
Fig. B.3
Download original image
Upper panel: Stacked saliency map for CNN Model 2, where the halo’s central galaxy baryonic particles are partitioned into 40 uniform bins, ranging from the center of the halo out to 16 Rhalf,fit. These bins are used to construct the input maps for training and testing the model. Lower panel: Line plots showing the pixel intensity variation as a function of normalized radius (r/Rhalf,fit) for each row of the stacked saliency map. Each line corresponds to a different physical property. The gray region in each plot indicates the aperture range identified by the network as most relevant for prediction. This region accounts for approximately 22% of the total area under each curve.
Current usage metrics show cumulative count of Article Views (full-text article views including HTML views, PDF and ePub downloads, according to the available data) and Abstracts Views on Vision4Press platform.
Data correspond to usage on the plateform after 2015. The current usage metrics is available 48-96 hours after online publication and is updated daily on week days.
Initial download of the metrics may take a while.