Fig. B.4
Download original image
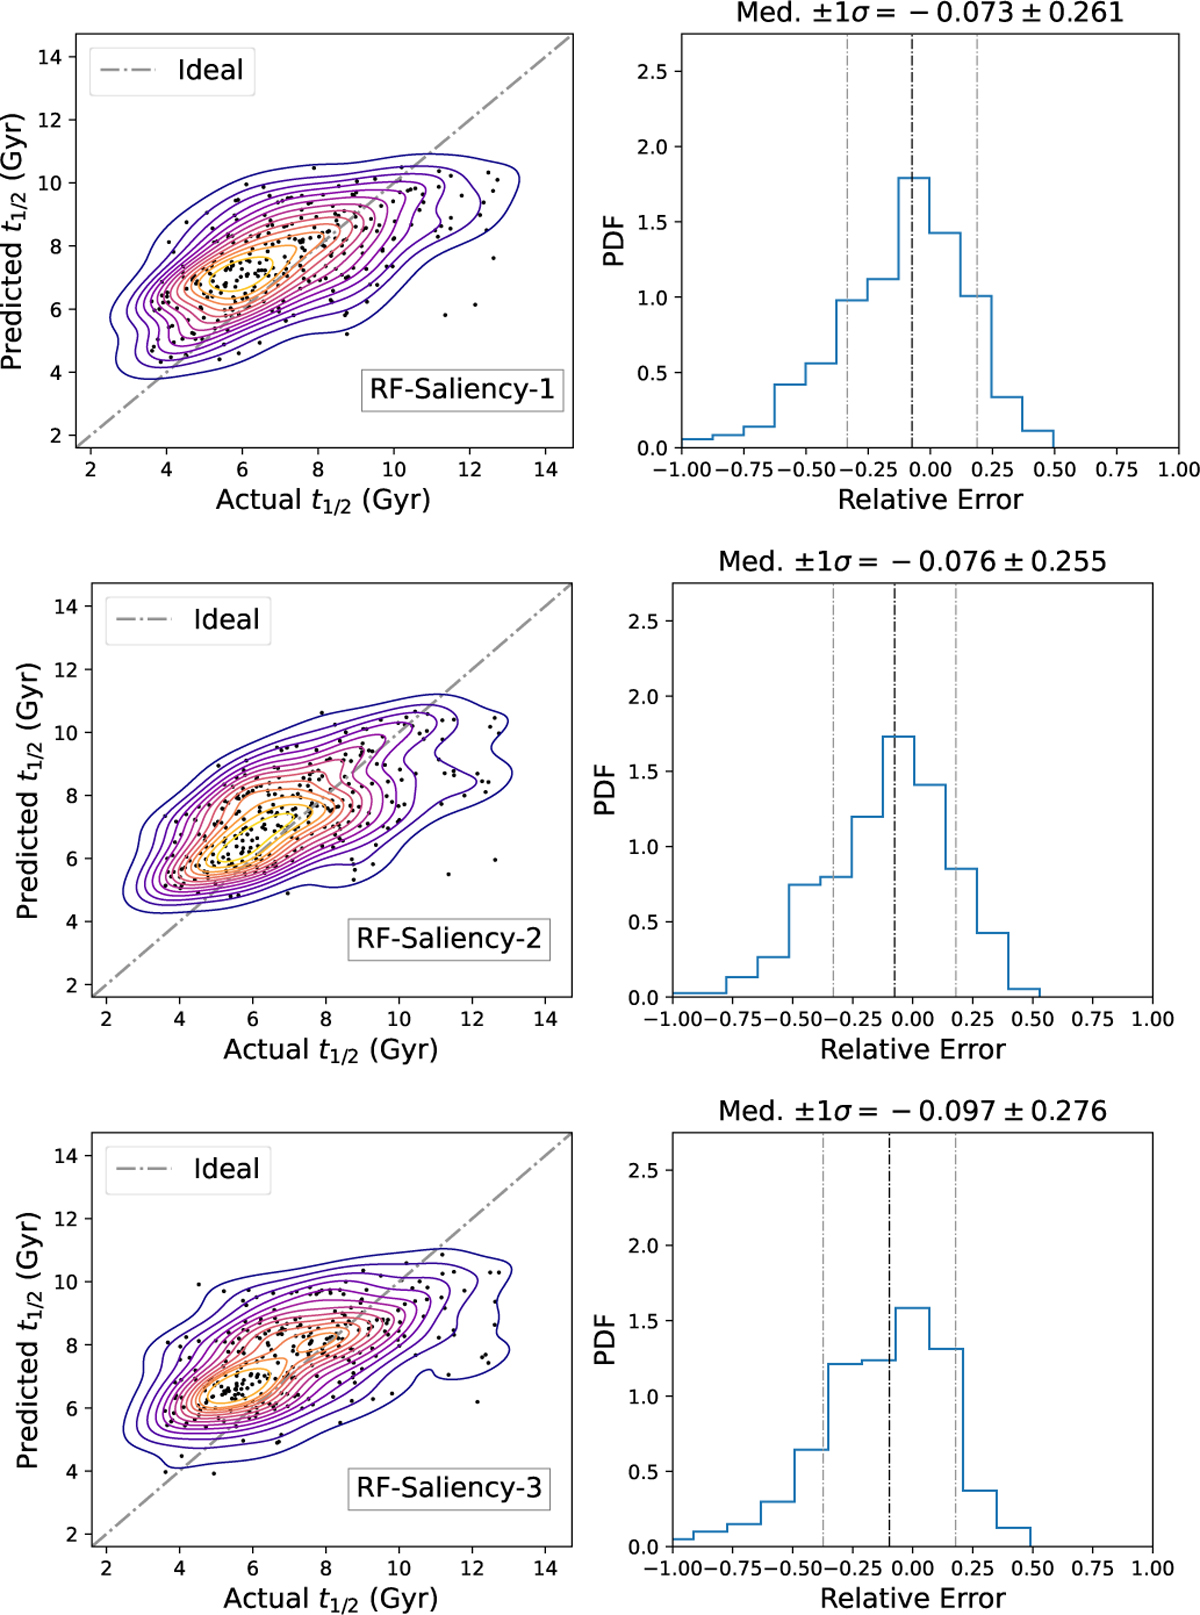
Comparison of predicted t1/2 values from the three random forest models with their true values from the test dataset. Each model is trained on properties derived from the aperture radial ranges identified by the saliency maps, as listed in Table B.1. Results for the model trained with the aperture range from CNN Model 1 are shown in the first row, CNN Model 2 in the second row, and CNN Model 3 in the third row. Left panel: Two-dimensional joint probability density functions comparing true and predicted t1/2 values. Black points represent predicted versus true values for the random forest model trained on the saliency-identified aperture range. The dotted gray 45-degree line indicates perfect prediction. Right panel: Probability density functions of the relative errors between predicted and true t1/2 values, highlighting the median error and standard deviation.
Current usage metrics show cumulative count of Article Views (full-text article views including HTML views, PDF and ePub downloads, according to the available data) and Abstracts Views on Vision4Press platform.
Data correspond to usage on the plateform after 2015. The current usage metrics is available 48-96 hours after online publication and is updated daily on week days.
Initial download of the metrics may take a while.