Fig. 3
Download original image
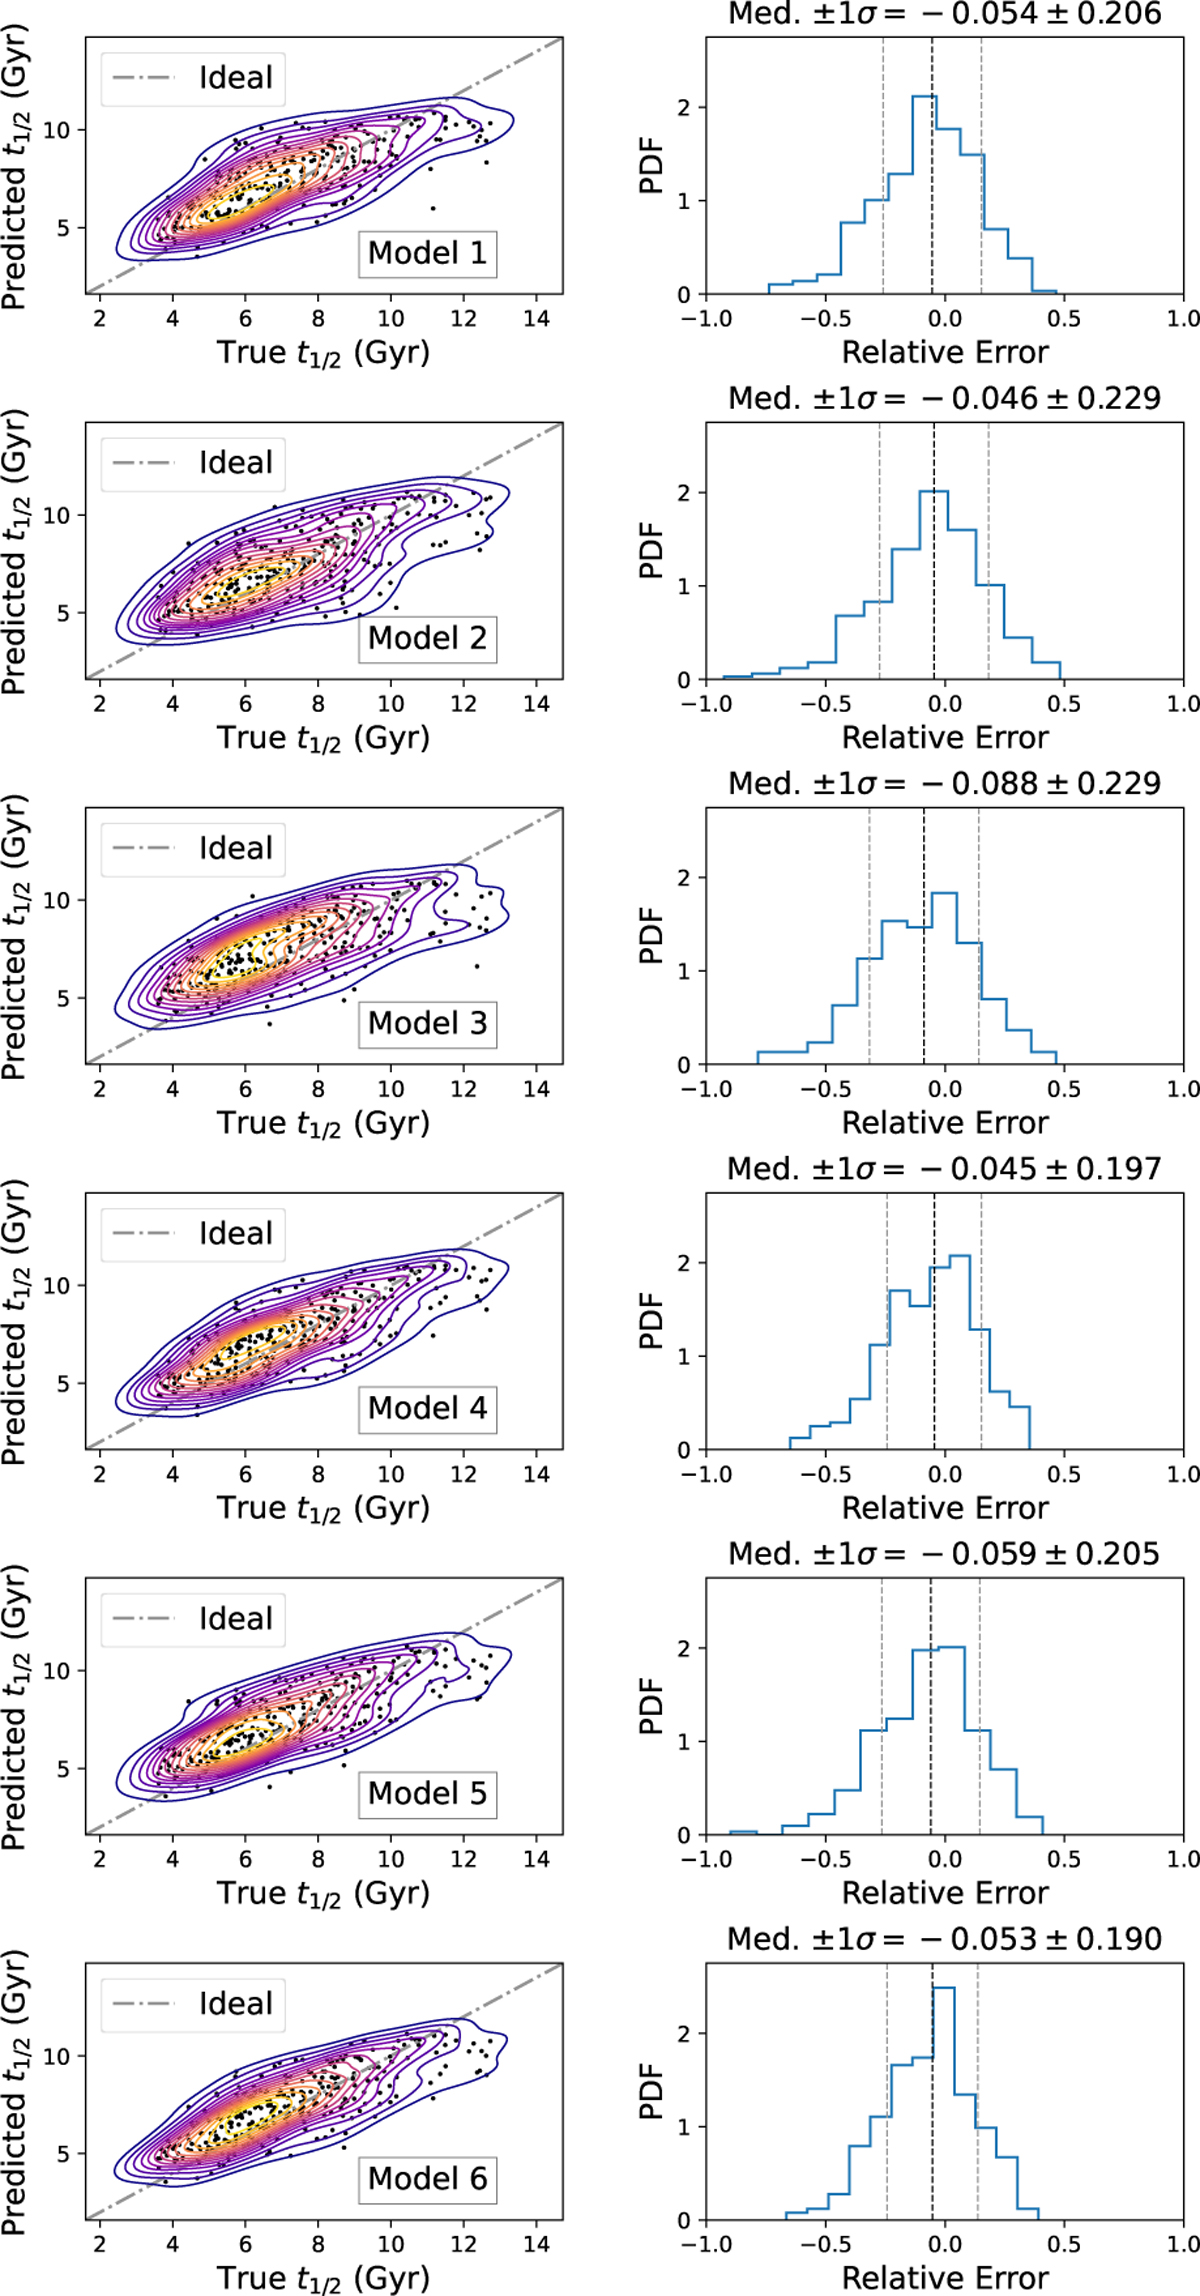
Left panel: relationship between the true and the predicted t1/2 values using the six trained RF models through a bi-variate joint distribution or 2D probability density function. The black data points represent the scatter between the RF predictions and the true t1/2 values for the test dataset relative to the ideal case of perfect predictions, depicted by a 45-degree dotted gray diagonal line. Right panel: probability density function for the relative errors between the true t1/2 and the predicted values by the RF models, along with the median error and the standard deviation, 1σ.
Current usage metrics show cumulative count of Article Views (full-text article views including HTML views, PDF and ePub downloads, according to the available data) and Abstracts Views on Vision4Press platform.
Data correspond to usage on the plateform after 2015. The current usage metrics is available 48-96 hours after online publication and is updated daily on week days.
Initial download of the metrics may take a while.