Fig. 8
Download original image
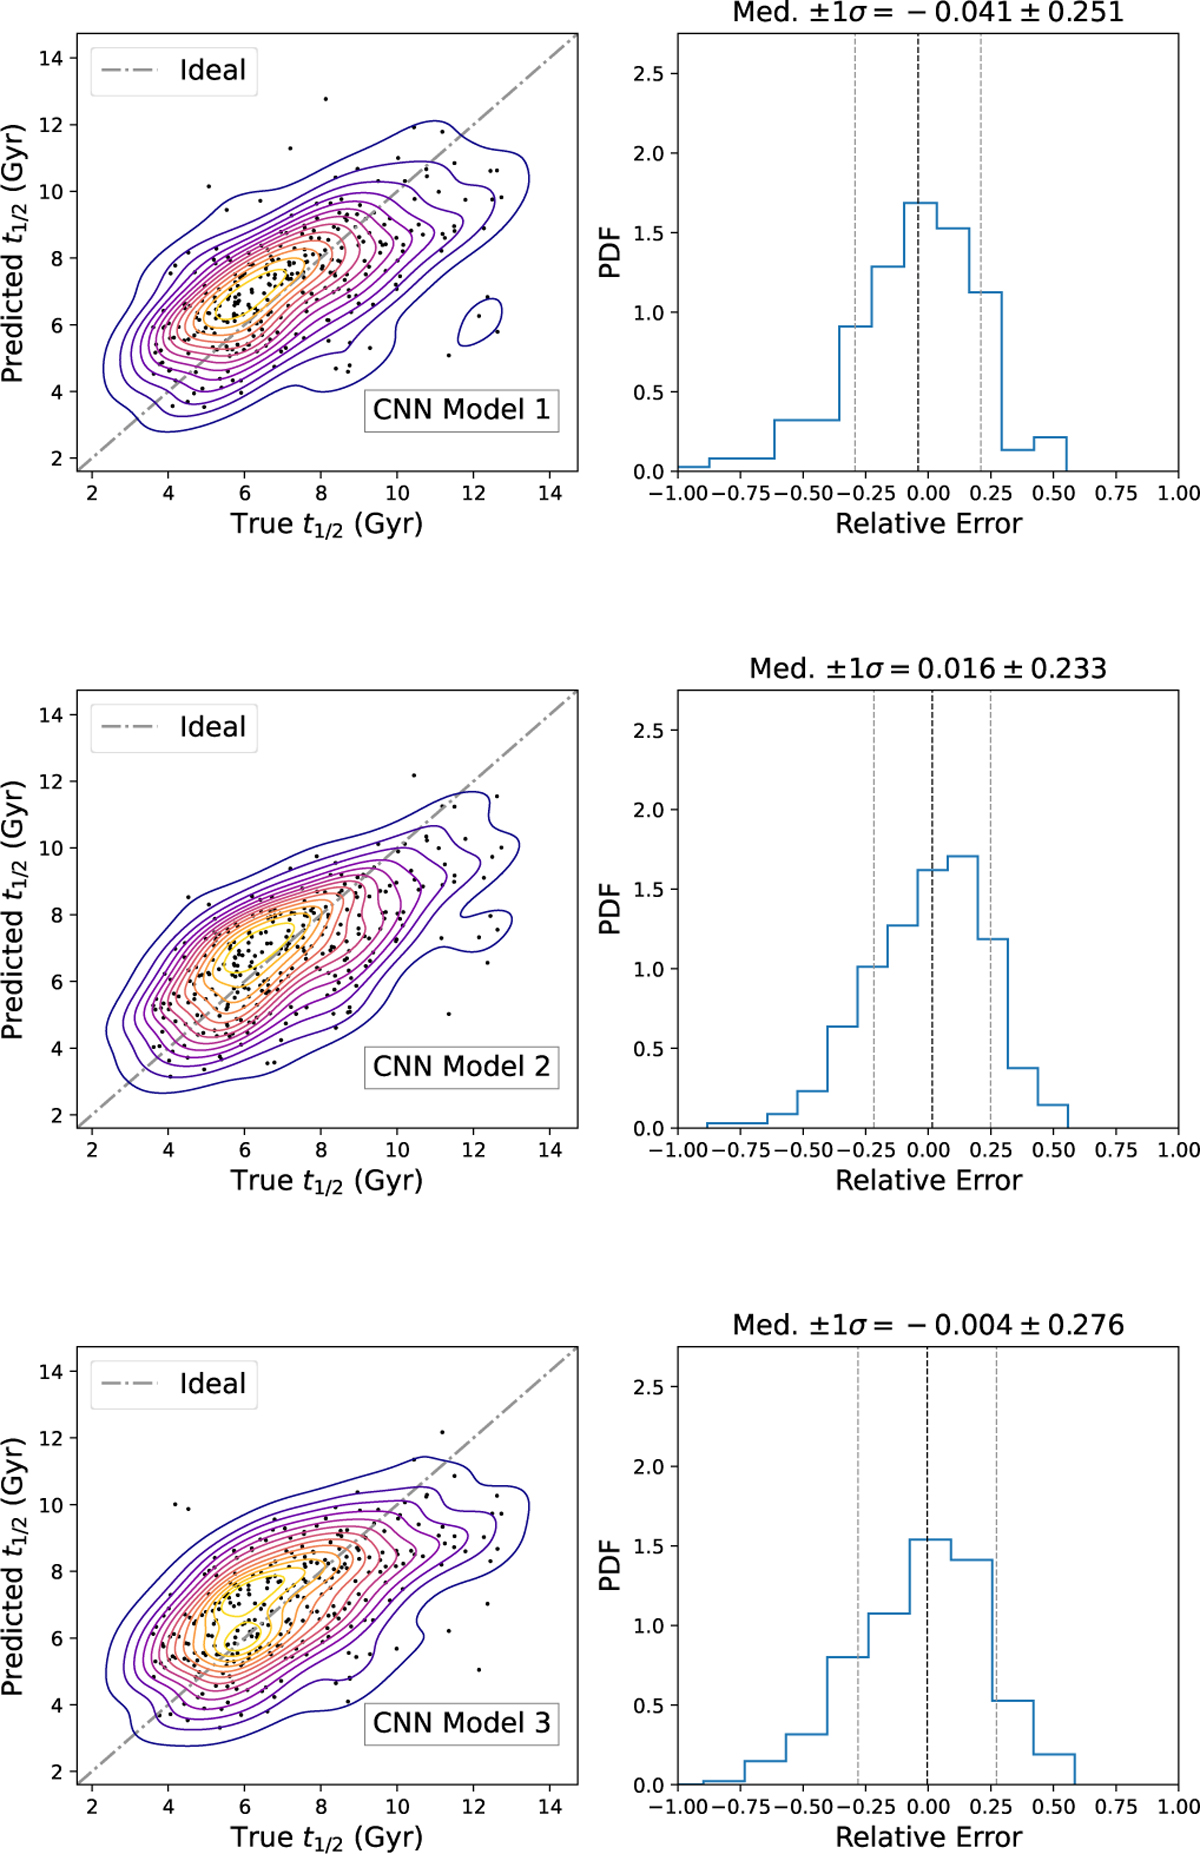
Predictions of the halo formation time (t1/2) and corresponding accuracy assessment for the three CNN models. Left panel: scatter plots (black points) showing the true versus predicted t1/2 values for the test dataset. Contour lines indicate the joint two-dimensional distribution, and the dashed 45-degree line represents perfect prediction. Right panel: probability density functions of the relative errors between predicted and true t1/2 values, showing the median and standard deviation (1σ) for each model.
Current usage metrics show cumulative count of Article Views (full-text article views including HTML views, PDF and ePub downloads, according to the available data) and Abstracts Views on Vision4Press platform.
Data correspond to usage on the plateform after 2015. The current usage metrics is available 48-96 hours after online publication and is updated daily on week days.
Initial download of the metrics may take a while.